2,686
Views
104
CrossRef citations to date
0
Altmetric
Report

Subcellular localization of the APOBEC3 proteins during mitosis and implications for genomic DNA deamination

, , &
Pages 762-772 | Published online: 06 Feb 2013

Figures & data

Figure 1. A3A-E72A, A3C and A3H are excluded from DNA as the chromosomes condense but become cell-wide during telophase. (A) Images of HeLa cells in prophase expressing the indicated APOBEC3-eGFP constructs (top) merged with Hoechst stain to visualize the nuclei (merge, middle). Boxed regions (bottom) are magnified below each image with APOBEC3-eGFP exclusion from DNA indicated (white arrows). (B) Images of HeLa cells in telophase expressing indicated APOBEC3-eGFP constructs (top), merged with nuclear stain (middle) and magnified (bottom). All images are representative of at least three mitotic cells. See Figure S2 for APOBEC3-eGFP localization during metaphase and anaphase and Videos S1 and S2 for time-lapse images of A3A-E72A-mCherry localization during mitosis.
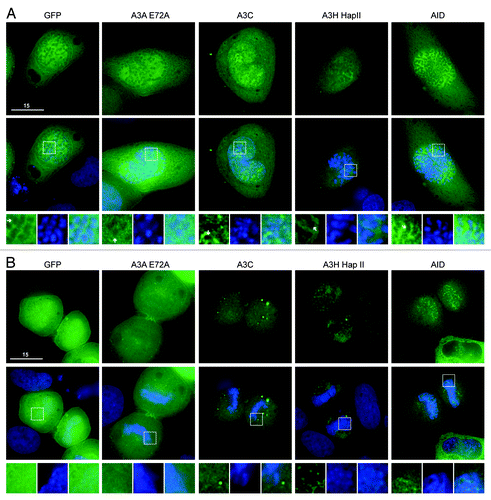
Figure 1. A3A-E72A, A3C and A3H are excluded from DNA as the chromosomes condense but become cell-wide during telophase. (A) Images of HeLa cells in prophase expressing the indicated APOBEC3-eGFP constructs (top) merged with Hoechst stain to visualize the nuclei (merge, middle). Boxed regions (bottom) are magnified below each image with APOBEC3-eGFP exclusion from DNA indicated (white arrows). (B) Images of HeLa cells in telophase expressing indicated APOBEC3-eGFP constructs (top), merged with nuclear stain (middle) and magnified (bottom). All images are representative of at least three mitotic cells. See Figure S2 for APOBEC3-eGFP localization during metaphase and anaphase and Videos S1 and S2 for time-lapse images of A3A-E72A-mCherry localization during mitosis.

Figure 2. A3B, A3D, A3F and A3G are excluded from DNA during cell division. (A) Images of HeLa cells in prophase expressing the indicated APOBEC3-eGFP constructs (top). Cells were stained with Hoechst dye to identify the nuclei (merge, middle). Boxed regions (bottom) are blown up below each image with APOBEC3 exclusion indicated (white arrows). (B) Images of HeLa cells in telophase expressing indicated APOBEC3-eGFP constructs (top), merged with nuclear stain (middle) and magnified (bottom). All images are representative of at least three mitotic cells. See Figure S4 for APOBEC3-eGFP localization during metaphase and anaphase and Videos S3 and S4 for time-lapse images of A3F-mCherry localization during mitosis.
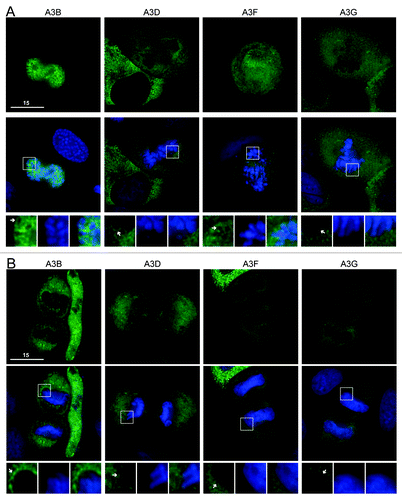
Figure 2. A3B, A3D, A3F and A3G are excluded from DNA during cell division. (A) Images of HeLa cells in prophase expressing the indicated APOBEC3-eGFP constructs (top). Cells were stained with Hoechst dye to identify the nuclei (merge, middle). Boxed regions (bottom) are blown up below each image with APOBEC3 exclusion indicated (white arrows). (B) Images of HeLa cells in telophase expressing indicated APOBEC3-eGFP constructs (top), merged with nuclear stain (middle) and magnified (bottom). All images are representative of at least three mitotic cells. See Figure S4 for APOBEC3-eGFP localization during metaphase and anaphase and Videos S3 and S4 for time-lapse images of A3F-mCherry localization during mitosis.

Figure 3. Untagged A3B and A3G are excluded from genomic DNA in the same manner as HA- and eGFP-tagged derivatives. (A) Images of HeLa cells transfected with untagged A3B labeled with anti-A3B and anti-rabbit FITC (top) then stained with Hoechst dye to illuminate the DNA (bottom). The indicated progression through telophase (early and late) was based on chromatin condensation. (B) Images of HeLa cells transfected with untagged A3G labeled with anti-A3G and anti-rabbit FITC (top) and DNA stain as before (bottom). Representative images are based on several telophase cells.
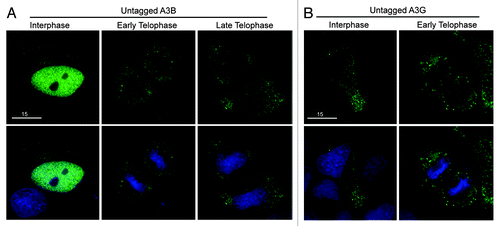
Figure 3. Untagged A3B and A3G are excluded from genomic DNA in the same manner as HA- and eGFP-tagged derivatives. (A) Images of HeLa cells transfected with untagged A3B labeled with anti-A3B and anti-rabbit FITC (top) then stained with Hoechst dye to illuminate the DNA (bottom). The indicated progression through telophase (early and late) was based on chromatin condensation. (B) Images of HeLa cells transfected with untagged A3G labeled with anti-A3G and anti-rabbit FITC (top) and DNA stain as before (bottom). Representative images are based on several telophase cells.

Figure 4. Localization of single domain variants of A3B, A3D, A3F and A3G. (A) Images of HeLa cells in telophase expressing N-terminal or (B) C-terminal halves of the indicated APOBEC3-eGFP constructs. DAPI and merged images below. Wild-type A3D-CTD was toxic, so a catalytic mutant was used (A3D-CTD-E264A; indicated by *). All images are representative of several telophase cells. (C) Representative images of HeLa cells in interphase expressing the N-terminal halves of the indicated APOBEC3-eGFP constructs.
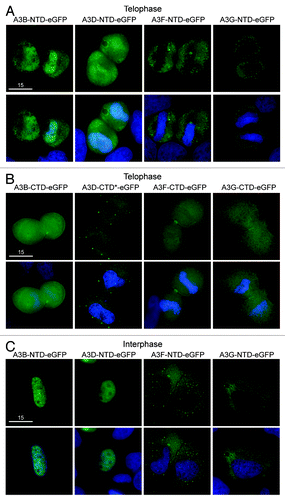
Figure 4. Localization of single domain variants of A3B, A3D, A3F and A3G. (A) Images of HeLa cells in telophase expressing N-terminal or (B) C-terminal halves of the indicated APOBEC3-eGFP constructs. DAPI and merged images below. Wild-type A3D-CTD was toxic, so a catalytic mutant was used (A3D-CTD-E264A; indicated by *). All images are representative of several telophase cells. (C) Representative images of HeLa cells in interphase expressing the N-terminal halves of the indicated APOBEC3-eGFP constructs.

Figure 5. Similar A3B deaminase activity in untreated, S-phase and mitotic cell lysates. (A) Cell cycle profiles of asynchronous cells (red), S-phase cells (blue) and mitotic cells (green). See methods for synchronization details. (B) Deaminase assay using lysates from cell populations shown in (A). (C) Immunoblot of protein lysates from (A) probed with anti-A3B or anti-tubulin antibodies.
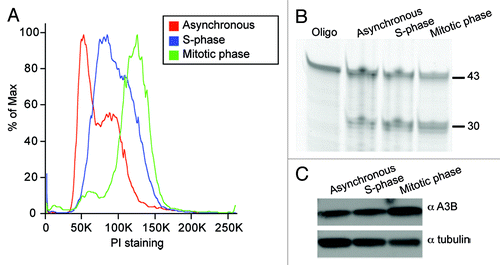
Figure 5. Similar A3B deaminase activity in untreated, S-phase and mitotic cell lysates. (A) Cell cycle profiles of asynchronous cells (red), S-phase cells (blue) and mitotic cells (green). See methods for synchronization details. (B) Deaminase assay using lysates from cell populations shown in (A). (C) Immunoblot of protein lysates from (A) probed with anti-A3B or anti-tubulin antibodies.

Figure 6. APOBEC3 effects on cell cycle progression in HEK293T cells. (A) DNA flow cytometry profiles of HEK293T cells transfected with APOBEC3-eGFP constructs. Representative profiles of triplicate independent PI-staining experiments are shown at 48 h. APOBEC3-eGFP expressing cell profiles (red) are overlaid on untransfected cells in the same population (blue). The shift toward S-phase in A3A-eGFP expressing cells is indicated (black arrow). (B) Expression of the indicated APOBEC3-eGFP proteins in HEK293T cells as shown by flow cytometry (top) and immunoblotting (bottom).
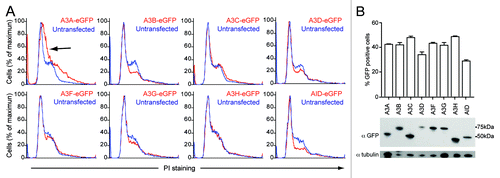
Figure 6. APOBEC3 effects on cell cycle progression in HEK293T cells. (A) DNA flow cytometry profiles of HEK293T cells transfected with APOBEC3-eGFP constructs. Representative profiles of triplicate independent PI-staining experiments are shown at 48 h. APOBEC3-eGFP expressing cell profiles (red) are overlaid on untransfected cells in the same population (blue). The shift toward S-phase in A3A-eGFP expressing cells is indicated (black arrow). (B) Expression of the indicated APOBEC3-eGFP proteins in HEK293T cells as shown by flow cytometry (top) and immunoblotting (bottom).
Supplemental material

Additional material

Download Zip (12.2 MB)

Reprints and Corporate Permissions

Please note: Selecting permissions does not provide access to the full text of the article, please see our help page How do I view content?

To request a reprint or corporate permissions for this article, please click on the relevant link below:

Academic Permissions

Please note: Selecting permissions does not provide access to the full text of the article, please see our help page How do I view content?

Obtain permissions instantly via Rightslink by clicking on the button below:

If you are unable to obtain permissions via Rightslink, please complete and submit this Permissions form. For more information, please visit our Permissions help page.