1,386
Views
38
CrossRef citations to date
0
Altmetric
Report

VDAC3 and Mps1 negatively regulate ciliogenesis

&
Pages 849-858 | Published online: 06 Feb 2013

Figures & data

Figure 1. VDAC3 depletion led to primary cilia assembly in non-starved cells. (A and B) Asynchronously growing RPE1 cells treated with siRNAs against Lamin A/C (siCon), VDAC3 (siVDAC3-1) and Mps1 (siMps1) were stained for γ-tub and Ac-tub to identify centrosome and primary cilia respectively. (A) Shown are representative images of random fields of siCon and siVDAC3-1 cells stained for γ-tub (red) and Ac-tub (green). Arrows mark cilia. (B) Percentage of cells with cilia were plotted as bars where values represent mean ± SD for three independent experiments, 400–500 cells were counted per replicate. (C) Immunoblots show the depletion of VDAC3 (VDAC3a and VDAC3b were decreased by roughly 40% and by 75%) in siVDAC3-1 cells (siVD3-1) and Mps1 (by roughly 85%) in siMps1 cells compared with siCon cells prepared similarly as (B). GAPDH or α-tub was used as loading control. (D) Asynchronously growing siCon and siVDAC3-1 cells were stained for polyglutamylated tubulin (GT335, green) and Cep135 (red). Percentage of cells with cilia were plotted where values represent mean ± SD for three independent experiments, roughly 200 cells were counted per replicate. In this and all other images, panels show digitally magnified images of a region surrounded by the box. (E) Representative image of a siVDAC3-1 cells prepared as in (A) stained for Arl13B (red) and Ac-tub (green). (F and G) siVDAC3-1 cells were transfected with plasmids expressing GFP or GFP-sirVDAC3. (F) Shown is a representative field of siVDAC3-1 cells stained for Cep135 (red) and Ac-tub (magenta). The cell that expressed GFP-sirVDAC3 (green) did not contain a primary cilium while the other untransfected cells had cilia as marked by arrows. DNA is blue and bar is 5 μm in (A–G). (G) The percentage of GFP-positive cells containing cilia were plotted as bars. Values represent mean ± SD for three independent experiments, 50–70 GFP-positive cells counted per replicate.
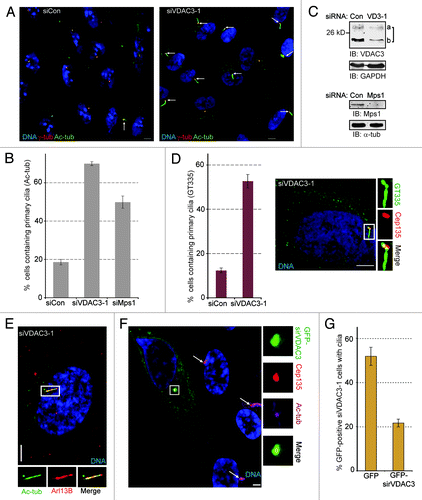
Figure 1. VDAC3 depletion led to primary cilia assembly in non-starved cells. (A and B) Asynchronously growing RPE1 cells treated with siRNAs against Lamin A/C (siCon), VDAC3 (siVDAC3-1) and Mps1 (siMps1) were stained for γ-tub and Ac-tub to identify centrosome and primary cilia respectively. (A) Shown are representative images of random fields of siCon and siVDAC3-1 cells stained for γ-tub (red) and Ac-tub (green). Arrows mark cilia. (B) Percentage of cells with cilia were plotted as bars where values represent mean ± SD for three independent experiments, 400–500 cells were counted per replicate. (C) Immunoblots show the depletion of VDAC3 (VDAC3a and VDAC3b were decreased by roughly 40% and by 75%) in siVDAC3-1 cells (siVD3-1) and Mps1 (by roughly 85%) in siMps1 cells compared with siCon cells prepared similarly as (B). GAPDH or α-tub was used as loading control. (D) Asynchronously growing siCon and siVDAC3-1 cells were stained for polyglutamylated tubulin (GT335, green) and Cep135 (red). Percentage of cells with cilia were plotted where values represent mean ± SD for three independent experiments, roughly 200 cells were counted per replicate. In this and all other images, panels show digitally magnified images of a region surrounded by the box. (E) Representative image of a siVDAC3-1 cells prepared as in (A) stained for Arl13B (red) and Ac-tub (green). (F and G) siVDAC3-1 cells were transfected with plasmids expressing GFP or GFP-sirVDAC3. (F) Shown is a representative field of siVDAC3-1 cells stained for Cep135 (red) and Ac-tub (magenta). The cell that expressed GFP-sirVDAC3 (green) did not contain a primary cilium while the other untransfected cells had cilia as marked by arrows. DNA is blue and bar is 5 μm in (A–G). (G) The percentage of GFP-positive cells containing cilia were plotted as bars. Values represent mean ± SD for three independent experiments, 50–70 GFP-positive cells counted per replicate.

Figure 2. A non-mitochondrial pool of VDAC3 negatively regulate ciliogenesis. (A) Asynchronously growing RPE1 cells were treated with DMSO (16 h), 1 or 2 μM Erastin (16 h), 0.1 μM Cytochalasin D (Cyto D; 16 h), 50 μM FCCP (16 h) and 250 μM FCCP (for 4 h), fixed and stained for Ac-tub to identify cilia. Percentage of cells containing cilia were plotted as bars and values represent mean ± SD for three independent experiments, where at least 100 cells were counted per replicate. (B) RPE1 cells expressing GFP or GFP-VDAC3 (green) were serum starved for 48 h and stained for Ac-tub. Values represent the mean ± SD for three independent experiments, where 50–75 GFP-positive cells were counted per replicate. Shown is a random field containing GFP-VDAC3 expressing (green) and non-expressing cells stained for Ac-tub (magenta), γ-tub (red) and DNA (blue). Arrow marks the cilium. (C and D) Cells prepared as in were labeled with BrdU for 4 h. Bar graph shows the percentage of BrdU-positive cells with Ac-tub stained cilia. Values represent the mean ± SD for three independent experiments, where at least 100 cells were counted per replicate. (D) Representative image of a siVDAC3-1 cell stained for CP110 (red), Ac-tub (green) and BrdU (blue). Bar is 5 μm in (B and D).
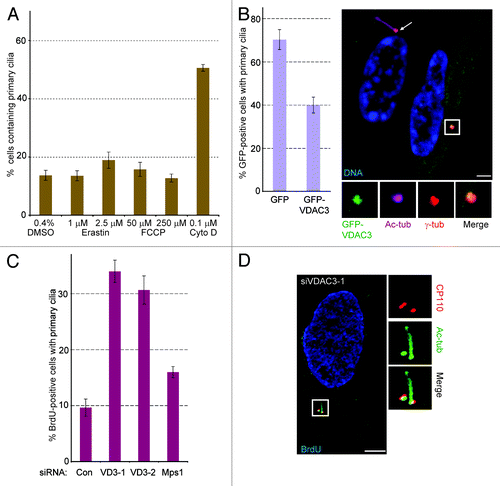
Figure 2. A non-mitochondrial pool of VDAC3 negatively regulate ciliogenesis. (A) Asynchronously growing RPE1 cells were treated with DMSO (16 h), 1 or 2 μM Erastin (16 h), 0.1 μM Cytochalasin D (Cyto D; 16 h), 50 μM FCCP (16 h) and 250 μM FCCP (for 4 h), fixed and stained for Ac-tub to identify cilia. Percentage of cells containing cilia were plotted as bars and values represent mean ± SD for three independent experiments, where at least 100 cells were counted per replicate. (B) RPE1 cells expressing GFP or GFP-VDAC3 (green) were serum starved for 48 h and stained for Ac-tub. Values represent the mean ± SD for three independent experiments, where 50–75 GFP-positive cells were counted per replicate. Shown is a random field containing GFP-VDAC3 expressing (green) and non-expressing cells stained for Ac-tub (magenta), γ-tub (red) and DNA (blue). Arrow marks the cilium. (C and D) Cells prepared as in Figure 1A were labeled with BrdU for 4 h. Bar graph shows the percentage of BrdU-positive cells with Ac-tub stained cilia. Values represent the mean ± SD for three independent experiments, where at least 100 cells were counted per replicate. (D) Representative image of a siVDAC3-1 cell stained for CP110 (red), Ac-tub (green) and BrdU (blue). Bar is 5 μm in (B and D).

Figure 3. Centrosomal levels of Mps1 and VDAC3 were reduced in starved cells and increased after serum addition. (A) Immunoblots show the cellular level of Mps1 in RPE1 lystes from cells that were asynchronously growing (Asyn), serum starved (SS), are starved and stimulated with serum for 20 h (SA). α-tub was used as loading control. (B–D) Shown are representative fields of RPE1 cells that were serum starved (SS) or serum stimulated for 20 h (SA) and; (B) labeled with BrdU (blue) and stained for Mps1 (green) and γ-tub (red); (C) stained for Mps1 (green), Arl13B (magenta), γ-tub (red) and DNA (blue), or (D) stained for VDAC3 (red) and Cep170 (green). SS cells were stained for DNA (blue) and SA cells were labeled with BrdU (blue) in (D). The centrosome and/or cilia of every cell are indicated by a box, magnified panels are shown for cells marked by arrows. Bar = 5 μm in (B–D).
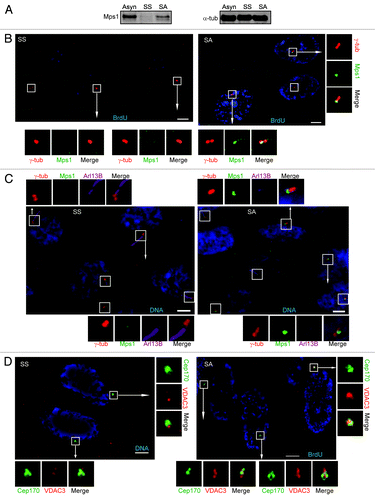
Figure 3. Centrosomal levels of Mps1 and VDAC3 were reduced in starved cells and increased after serum addition. (A) Immunoblots show the cellular level of Mps1 in RPE1 lystes from cells that were asynchronously growing (Asyn), serum starved (SS), are starved and stimulated with serum for 20 h (SA). α-tub was used as loading control. (B–D) Shown are representative fields of RPE1 cells that were serum starved (SS) or serum stimulated for 20 h (SA) and; (B) labeled with BrdU (blue) and stained for Mps1 (green) and γ-tub (red); (C) stained for Mps1 (green), Arl13B (magenta), γ-tub (red) and DNA (blue), or (D) stained for VDAC3 (red) and Cep170 (green). SS cells were stained for DNA (blue) and SA cells were labeled with BrdU (blue) in (D). The centrosome and/or cilia of every cell are indicated by a box, magnified panels are shown for cells marked by arrows. Bar = 5 μm in (B–D).

Figure 4. Mps1 controls ciliary diassembly during serum stimulation. (A) siCon, siVDAC3-1 and siMps1 cells were serum starved (SS), stimulated with serum for 20 h (SA) and fixed. Cells were stained for Ac-tub and the percentage of cells with primary cilia were plotted as bars. Values represent mean ± SD for three independent experiments, where at least 200 cells were counted per replicate. (B and C) RPE1 cells expressing GFP or GFP-Mps1 were serum starved for 48 h, stained for Ac-tub and the GFP-positive cells containing primary cilia were counted. (B) Values represent the mean ± SD for three independent experiments, where 60–75 cells were counted per replicate. (C) Representative image of a serum starved GFP-Mps1 (green) expressing RPE1 cell stained for γ-tub (magenta), Ac-tub (red) and DNA (blue). Bar is 5 μm.
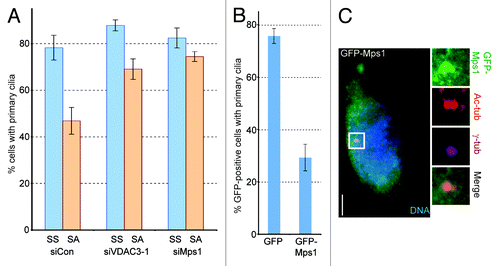
Figure 4. Mps1 controls ciliary diassembly during serum stimulation. (A) siCon, siVDAC3-1 and siMps1 cells were serum starved (SS), stimulated with serum for 20 h (SA) and fixed. Cells were stained for Ac-tub and the percentage of cells with primary cilia were plotted as bars. Values represent mean ± SD for three independent experiments, where at least 200 cells were counted per replicate. (B and C) RPE1 cells expressing GFP or GFP-Mps1 were serum starved for 48 h, stained for Ac-tub and the GFP-positive cells containing primary cilia were counted. (B) Values represent the mean ± SD for three independent experiments, where 60–75 cells were counted per replicate. (C) Representative image of a serum starved GFP-Mps1 (green) expressing RPE1 cell stained for γ-tub (magenta), Ac-tub (red) and DNA (blue). Bar is 5 μm.

Figure 5. Targeting Mps1 to centrosomes independently of VDAC3 suppresses aberrant ciliogenesis in siVDAC3 cells. (A and D) Asynchronously growing siCon or siVDAC3-1 cells expressing GFP-PACT (green) or GFP-Mps1-PACT (green) were stained for Ac-tub to examine the presence of primary cilia. (A and B) Shown are representative images of indicated cells stained for γ-tub (red) and Ac-tub (magenta). (C) An image of a random field of siVDAC3-1 population, where the cell in the right was expressing GFP-Mps1-PACT but the cell in the left was untransfected, stained for γ-tub (red) and Ac-tub (magenta). The GFP-Mps1-PACT expressing cell does not contain a cilium while the non-expressing one contains a cilium. DNA is blue and bar = 5 μm in (A–C). (D) Percentage of GFP-positive cells with cilia, values represent the mean ± SD for three independent experiments, 100 cells counted per replicate.
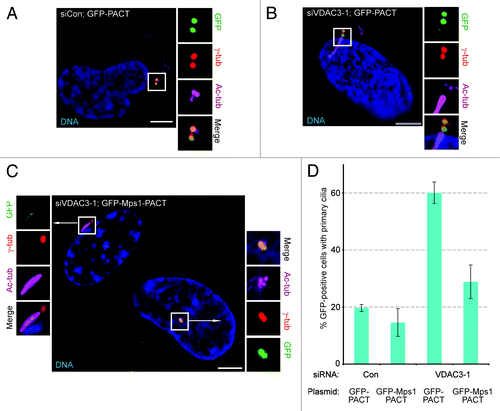
Figure 5. Targeting Mps1 to centrosomes independently of VDAC3 suppresses aberrant ciliogenesis in siVDAC3 cells. (A and D) Asynchronously growing siCon or siVDAC3-1 cells expressing GFP-PACT (green) or GFP-Mps1-PACT (green) were stained for Ac-tub to examine the presence of primary cilia. (A and B) Shown are representative images of indicated cells stained for γ-tub (red) and Ac-tub (magenta). (C) An image of a random field of siVDAC3-1 population, where the cell in the right was expressing GFP-Mps1-PACT but the cell in the left was untransfected, stained for γ-tub (red) and Ac-tub (magenta). The GFP-Mps1-PACT expressing cell does not contain a cilium while the non-expressing one contains a cilium. DNA is blue and bar = 5 μm in (A–C). (D) Percentage of GFP-positive cells with cilia, values represent the mean ± SD for three independent experiments, 100 cells counted per replicate.
Supplemental material

Additional material

Download Zip (1.8 MB)

Reprints and Corporate Permissions

Please note: Selecting permissions does not provide access to the full text of the article, please see our help page How do I view content?

To request a reprint or corporate permissions for this article, please click on the relevant link below:

Academic Permissions

Please note: Selecting permissions does not provide access to the full text of the article, please see our help page How do I view content?

Obtain permissions instantly via Rightslink by clicking on the button below:

If you are unable to obtain permissions via Rightslink, please complete and submit this Permissions form. For more information, please visit our Permissions help page.