811
Views
15
CrossRef citations to date
0
Altmetric
Report

Dissecting cellular responses to irradiation via targeted disruptions of the ATM-CHK1-PP2A circuit

, , &
Pages 1105-1118 | Published online: 05 Mar 2013

Figures & data

Figure 1. Generation and validation of stable cell lines. (A) Checkpoint kinase-1 (CHK1) transcript structure, depicting the regions targeted by the shRNA constructs used in the current study: exon 6 (shRNA A); exon 11 (shRNA B) and the 3′-UTR (shRNA C). Also shown are the start and stop codons. (B) Representative western blot showing CHK1 expression in cell lines transduced with either the non-silencing shRNA or the CHK1 targeting constructs (CHK1A, CHK1B and CHK1C). (C) Quantification of CHK1 expression in stable HEK293 cell lines. The experiment was performed with three independent replicates and analyzed with Image Quant software (GE). Statistically significant differences are marked by asterisks (p < 0.05).
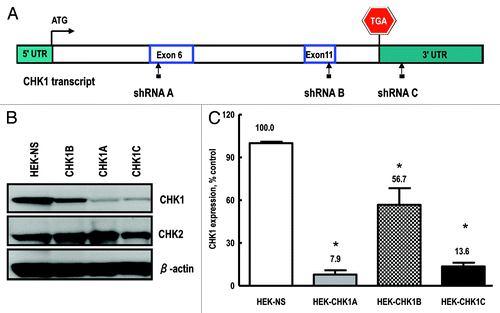
Figure 1. Generation and validation of stable cell lines. (A) Checkpoint kinase-1 (CHK1) transcript structure, depicting the regions targeted by the shRNA constructs used in the current study: exon 6 (shRNA A); exon 11 (shRNA B) and the 3′-UTR (shRNA C). Also shown are the start and stop codons. (B) Representative western blot showing CHK1 expression in cell lines transduced with either the non-silencing shRNA or the CHK1 targeting constructs (CHK1A, CHK1B and CHK1C). (C) Quantification of CHK1 expression in stable HEK293 cell lines. The experiment was performed with three independent replicates and analyzed with Image Quant software (GE). Statistically significant differences are marked by asterisks (p < 0.05).

Figure 2. CHK1-depleted cells display decreased survival following exposure to ionizing radiation. (A) The proportions of mitotic cells in HEK-NS and HEK-CHK1A cell lines under control conditions. Graphed data are an average of six biological replicates. All samples were treated and processed for cycle profiles as described in “Materials and Methods.” Briefly, at the indicated time points, the cells were trypsinized, washed with PBS, fixed in 4% paraformaldehyde and stored in PBS in preparation to mitotic cell determination by flow cytometry. (B) Cells were seeded in 96-well plates and allowed to recover overnight. For each time point, two sets of plates were prepared (untreated and irradiated). Cell viability measurements were performed at the indicated time points with the CellTiter Blue assay as described in “Materials and Methods.” The bars represent ratios of irradiated/untreated readings. The measurements were performed with 12 replicates per condition and cell line and tested for reproducibility in at least three independent experiments. Statistically significant differences are marked by asterisks (p < 0.05). (C) HEK-NS and HEK-CHK1A were seeded at a density of 100 cells per 100-mm plate and allowed to attach overnight. For each cell line, one group of plates was left untreated; four other groups were irradiated with 0.5, 1, 2 or 3 Gy γ-IR. After treatment, the plates were returned to the incubator without a media change and allowed to grow undisturbed for 10–14 d. Colonies were stained with methylene blue and counted. Cellular survival was calculated relative to control, which was set to 100%. The dashed horizontal line represents the 50% survival (LD50 = lethal dose 50, used here for referring to the dose that kills 50% of the tested cellular population).
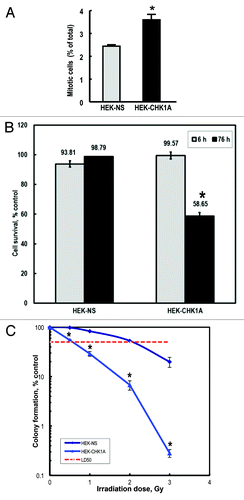
Figure 2. CHK1-depleted cells display decreased survival following exposure to ionizing radiation. (A) The proportions of mitotic cells in HEK-NS and HEK-CHK1A cell lines under control conditions. Graphed data are an average of six biological replicates. All samples were treated and processed for cycle profiles as described in “Materials and Methods.” Briefly, at the indicated time points, the cells were trypsinized, washed with PBS, fixed in 4% paraformaldehyde and stored in PBS in preparation to mitotic cell determination by flow cytometry. (B) Cells were seeded in 96-well plates and allowed to recover overnight. For each time point, two sets of plates were prepared (untreated and irradiated). Cell viability measurements were performed at the indicated time points with the CellTiter Blue assay as described in “Materials and Methods.” The bars represent ratios of irradiated/untreated readings. The measurements were performed with 12 replicates per condition and cell line and tested for reproducibility in at least three independent experiments. Statistically significant differences are marked by asterisks (p < 0.05). (C) HEK-NS and HEK-CHK1A were seeded at a density of 100 cells per 100-mm plate and allowed to attach overnight. For each cell line, one group of plates was left untreated; four other groups were irradiated with 0.5, 1, 2 or 3 Gy γ-IR. After treatment, the plates were returned to the incubator without a media change and allowed to grow undisturbed for 10–14 d. Colonies were stained with methylene blue and counted. Cellular survival was calculated relative to control, which was set to 100%. The dashed horizontal line represents the 50% survival (LD50 = lethal dose 50, used here for referring to the dose that kills 50% of the tested cellular population).

Figure 3. Mitotic indices of CHK1-depleted cells under control conditions and following genotoxic treatment. HEK-NS and HEK-CHK1A cells were plated, allowed to recover for 18–24 h and where appropriate, subjected to ionizing radiation (3 Gy γ-IR). All samples were treated and processed for cell cycle profiling as described in “Materials and Methods.” Briefly, at the indicated time points, the cells were trypsinized, washed with PBS, fixed in 4% paraformaldehyde and stored in PBS in preparation to mitotic cell determination by flow cytometry. (A) Relative mitotic indices of HEK-NS and HEK-CHK1A cell lines following irradiation were calculated by dividing the percentage of mitotic cells in the treated sample by the percentage of mitotic cells in its respective untreated sample and expressed as % control. Mean RMIs were then determined from at least three independent experiments and biological replicates. See supplementary files for flow cytometry profiles and Table S1 for the absolute values of mitotic cell measurements. (B) Proportions of cells in G2/M of the cell cycle following irradiation in HEK-NS and HEK-CHK1A cell lines (based on DNA content, less % mitotics based on phospho-H3). Statistically significant differences are marked by asterisks (p < 0.05).
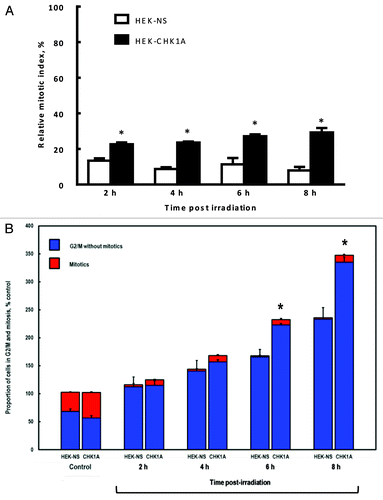
Figure 3. Mitotic indices of CHK1-depleted cells under control conditions and following genotoxic treatment. HEK-NS and HEK-CHK1A cells were plated, allowed to recover for 18–24 h and where appropriate, subjected to ionizing radiation (3 Gy γ-IR). All samples were treated and processed for cell cycle profiling as described in “Materials and Methods.” Briefly, at the indicated time points, the cells were trypsinized, washed with PBS, fixed in 4% paraformaldehyde and stored in PBS in preparation to mitotic cell determination by flow cytometry. (A) Relative mitotic indices of HEK-NS and HEK-CHK1A cell lines following irradiation were calculated by dividing the percentage of mitotic cells in the treated sample by the percentage of mitotic cells in its respective untreated sample and expressed as % control. Mean RMIs were then determined from at least three independent experiments and biological replicates. See supplementary files for flow cytometry profiles and Table S1 for the absolute values of mitotic cell measurements. (B) Proportions of cells in G2/M of the cell cycle following irradiation in HEK-NS and HEK-CHK1A cell lines (based on DNA content, less % mitotics based on phospho-H3). Statistically significant differences are marked by asterisks (p < 0.05).

Figure 4. ATM autophosphorylation in CHK1-depleted cells. (A) Time course of ATM activation in response to ionizing radiation as measured by phosphorylation of Ser1981 in HEK-NS and HEK-CHK1A cell lines. Graphed data are the average of three independent measurements ± SEM (B) Representative western blot showing increased ATM phosphorylation in HEK293 stable cell lines HEK-NS and HEK-CHK1A at 2 h post-irradiation. (C) Exponentially growing HEK293 cells were seeded at 50% confluency and allowed to attach overnight. Transfections were performed in 6-well dishes with 300 pmoles of non-targeting siRNA or CHK1 siRNA per well and Lipofectamine 2000 according to the manufacturer's instructions. At 48 h post-transfection the cells were pre-treated for 1 h with either vehicle (DMSO) or 10 µM Ku55933, followed by exposure to ionizing radiation (3 Gy γ-IR). The cells were harvested at 2 h post-IR and analyzed by western blot. (D) HEK-NS and HEK-CHK1A cell lines were seeded and allowed to recover for 18 h. Following irradiation at 3 Gy γ-IR, the cells received either vehicle (DMSO) or 10 µM Ku55933 after 30 min post-IR. The samples were harvested at 2 h post exposure and analyzed by western blot.
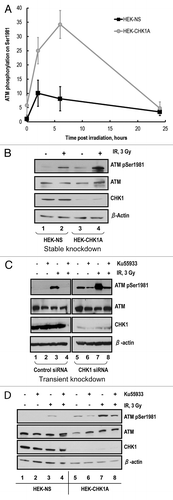
Figure 4. ATM autophosphorylation in CHK1-depleted cells. (A) Time course of ATM activation in response to ionizing radiation as measured by phosphorylation of Ser1981 in HEK-NS and HEK-CHK1A cell lines. Graphed data are the average of three independent measurements ± SEM (B) Representative western blot showing increased ATM phosphorylation in HEK293 stable cell lines HEK-NS and HEK-CHK1A at 2 h post-irradiation. (C) Exponentially growing HEK293 cells were seeded at 50% confluency and allowed to attach overnight. Transfections were performed in 6-well dishes with 300 pmoles of non-targeting siRNA or CHK1 siRNA per well and Lipofectamine 2000 according to the manufacturer's instructions. At 48 h post-transfection the cells were pre-treated for 1 h with either vehicle (DMSO) or 10 µM Ku55933, followed by exposure to ionizing radiation (3 Gy γ-IR). The cells were harvested at 2 h post-IR and analyzed by western blot. (D) HEK-NS and HEK-CHK1A cell lines were seeded and allowed to recover for 18 h. Following irradiation at 3 Gy γ-IR, the cells received either vehicle (DMSO) or 10 µM Ku55933 after 30 min post-IR. The samples were harvested at 2 h post exposure and analyzed by western blot.

Figure 5. CHK1 inhibition results in enhanced ATM phosphorylation. (A) HEK-NS and HEK-CHK1A cell lines were seeded and allowed to recover for 18 h. CHK1 inhibitor AZD7762 in the indicated concentrations or the vehicle control were added to the culture medium. The cells were harvested 6 h later. ATM phosphorylation on Ser1981 was analyzed by western blot and graphed as fold-change relative to the untreated control of the HEK-NS cell line. (B) CHK1 protein abundance and phosphorylation status in HEK293 stable cell lines. HEK-NS and HEK-CHK1A cell lines were seeded and allowed to recover for 18 h. The samples were harvested at 2 h post-irradiation with 3 Gy γ-IR and analyzed by western blot.
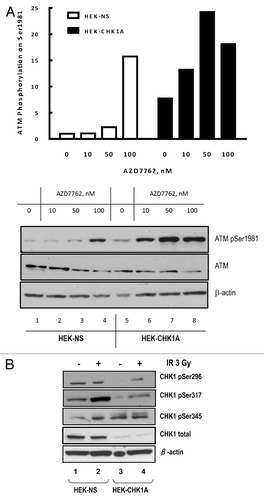
Figure 5. CHK1 inhibition results in enhanced ATM phosphorylation. (A) HEK-NS and HEK-CHK1A cell lines were seeded and allowed to recover for 18 h. CHK1 inhibitor AZD7762 in the indicated concentrations or the vehicle control were added to the culture medium. The cells were harvested 6 h later. ATM phosphorylation on Ser1981 was analyzed by western blot and graphed as fold-change relative to the untreated control of the HEK-NS cell line. (B) CHK1 protein abundance and phosphorylation status in HEK293 stable cell lines. HEK-NS and HEK-CHK1A cell lines were seeded and allowed to recover for 18 h. The samples were harvested at 2 h post-irradiation with 3 Gy γ-IR and analyzed by western blot.

Figure 6. Status of the PP2A catalytic subunit in nuclear extracts from CHK1-depleted cells. Subcellular fractionation was performed as described in “Materials and Methods.” For all samples, nuclear extracts were prepared from equal numbers of cells. The cells were treated with 10 nM AZD7762 1 h prior to irradiation with 3 Gy γ-IR and harvested at 2 h post-IR. Antibodies are against the catalytic subunit of PP2A (PP2A cat; total or phosphorylated on Y307).
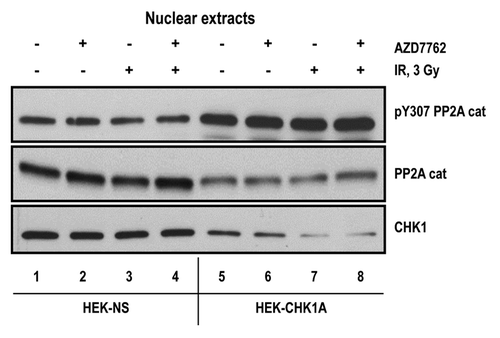
Figure 6. Status of the PP2A catalytic subunit in nuclear extracts from CHK1-depleted cells. Subcellular fractionation was performed as described in “Materials and Methods.” For all samples, nuclear extracts were prepared from equal numbers of cells. The cells were treated with 10 nM AZD7762 1 h prior to irradiation with 3 Gy γ-IR and harvested at 2 h post-IR. Antibodies are against the catalytic subunit of PP2A (PP2A cat; total or phosphorylated on Y307).

Figure 7. CHK1 expression and phosphorylation status in human mammary epithelial cell lines. To analyze CHK1 expression levels, the cells were cultured under normal growth conditions to a maximum of 70–80% confluency. At harvesting, the cell pellets for each sample were divided into two tubes, one for total RNA extraction and another one for protein extraction. The extractions were from at least three biological replicates for each indicated cell line. (A) CHK1 mRNA abundance was measured by qRT-PCR as described in “Materials and Methods.” (B) CHK1 protein abundance was analyzed by western blot. The graph is from the quantified and normalized data from at least three biological replicates. The wild-type expression level (LacZ-NS cell line) is set to 100% with the values obtained for all other cell lines recalculated relative to the wild-type control. (C) HME-CC cells were seeded 44–48 h prior to treatment with 3 Gy γ-IR and harvested at 2 h post-exposure.
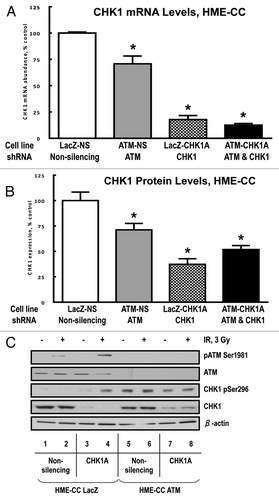
Figure 7. CHK1 expression and phosphorylation status in human mammary epithelial cell lines. To analyze CHK1 expression levels, the cells were cultured under normal growth conditions to a maximum of 70–80% confluency. At harvesting, the cell pellets for each sample were divided into two tubes, one for total RNA extraction and another one for protein extraction. The extractions were from at least three biological replicates for each indicated cell line. (A) CHK1 mRNA abundance was measured by qRT-PCR as described in “Materials and Methods.” (B) CHK1 protein abundance was analyzed by western blot. The graph is from the quantified and normalized data from at least three biological replicates. The wild-type expression level (LacZ-NS cell line) is set to 100% with the values obtained for all other cell lines recalculated relative to the wild-type control. (C) HME-CC cells were seeded 44–48 h prior to treatment with 3 Gy γ-IR and harvested at 2 h post-exposure.

Figure 8. ATM and CHK1 cooperation is required for both the early checkpoint response and recovery of the mitotic indices post-irradiation. HME-CC cells were seeded 44–48 h prior to treatment with 3 Gy γ-IR and harvested at the indicated time points post exposure. The samples were processed for flow cytometry analysis as described in “Materials and Methods.” Graphed data represents the relative mitotic values for 2 h (A) and 4 h post exposure (B). For experiments in HEK293 cells, HEK-NS and HEK-CHK1A cell lines were seeded and allowed to recover for 18 h. ATM inhibitor Ku55933(10 µM) or DMSO (vehicle) were added to the cell culture media 1 h prior to irradiation with 3 Gy γ-IR. All samples were collected at the indicated time points and processed for flow cytometry analysis as described in “Materials and Methods.” (C) Relative mitotic indices following irradiation ± Ku55933 in HEK-NS and HEK-CHK1A cells.
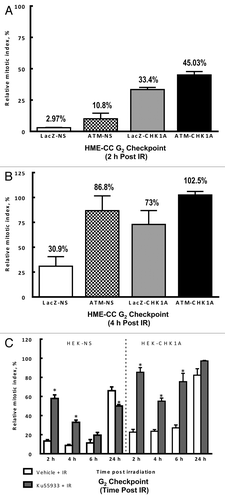
Figure 8. ATM and CHK1 cooperation is required for both the early checkpoint response and recovery of the mitotic indices post-irradiation. HME-CC cells were seeded 44–48 h prior to treatment with 3 Gy γ-IR and harvested at the indicated time points post exposure. The samples were processed for flow cytometry analysis as described in “Materials and Methods.” Graphed data represents the relative mitotic values for 2 h (A) and 4 h post exposure (B). For experiments in HEK293 cells, HEK-NS and HEK-CHK1A cell lines were seeded and allowed to recover for 18 h. ATM inhibitor Ku55933(10 µM) or DMSO (vehicle) were added to the cell culture media 1 h prior to irradiation with 3 Gy γ-IR. All samples were collected at the indicated time points and processed for flow cytometry analysis as described in “Materials and Methods.” (C) Relative mitotic indices following irradiation ± Ku55933 in HEK-NS and HEK-CHK1A cells.

Figure 9. Compensatory regulation within the ATM-CHK1-PP2A circuit. (A) Physiological phosphorylation of ATM and CHK1 is kept in balance by PP2A-mediated dephosphorylation events and a functional CHK1-PP2A feedback regulation loop. No phosphorylation is detectable under normal growth conditions and represents a response to genotoxins. (B) CHK1-depletion disrupts the feedback loop to PP2A and allows for the accumulation of phosphorylated ATM and CHK1 molecules that exceed the proportion of phosphorylated molecules in wild-type cells. Enhanced ATM phosphorylation can enforce the G2/M checkpoint in spite of impaired CHK1 function. (C) ATM deficiency in human mammary epithelial cells is accompanied by a CHK1 insufficiency at the protein expression level. The disruption in the PP2A-CHK1 feedback loop leads to higher CHK1 phosphorylation that may compensate for the lack of ATM.

Figure 9. Compensatory regulation within the ATM-CHK1-PP2A circuit. (A) Physiological phosphorylation of ATM and CHK1 is kept in balance by PP2A-mediated dephosphorylation events and a functional CHK1-PP2A feedback regulation loop. No phosphorylation is detectable under normal growth conditions and represents a response to genotoxins. (B) CHK1-depletion disrupts the feedback loop to PP2A and allows for the accumulation of phosphorylated ATM and CHK1 molecules that exceed the proportion of phosphorylated molecules in wild-type cells. Enhanced ATM phosphorylation can enforce the G2/M checkpoint in spite of impaired CHK1 function. (C) ATM deficiency in human mammary epithelial cells is accompanied by a CHK1 insufficiency at the protein expression level. The disruption in the PP2A-CHK1 feedback loop leads to higher CHK1 phosphorylation that may compensate for the lack of ATM.
Supplemental material

Additional material

Download Zip (2.1 MB)

Reprints and Corporate Permissions

Please note: Selecting permissions does not provide access to the full text of the article, please see our help page How do I view content?

To request a reprint or corporate permissions for this article, please click on the relevant link below:

Academic Permissions

Please note: Selecting permissions does not provide access to the full text of the article, please see our help page How do I view content?

Obtain permissions instantly via Rightslink by clicking on the button below:

If you are unable to obtain permissions via Rightslink, please complete and submit this Permissions form. For more information, please visit our Permissions help page.