1,080
Views
16
CrossRef citations to date
0
Altmetric
Report

HIC1 interacts with and modulates the activity of STAT3

, , , &
Pages 2266-2276 | Received 05 Mar 2013, Accepted 11 Jun 2013, Published online: 21 Jun 2013

Figures & data

Figure 1. HIC1 interacts with STAT3 in vivo and in vitro. (A) SYPRO Ruby gel shows STAT3 pulled down from the cell lysates of 293T cells expressing Flag-tagged HIC1 by immunoprecipitation with anti-Flag antibody. STAT3 peptides detected by mass spectrometry are indicated. (B) Western blots show complex formation of Flag-HIC1 and HA-STAT3 in HeLa cells by immunoprecipitation with indicated antibodies. IP, immunoprecipitation; WCL, whole cell lysates; WB, western blotting (C) Immunoblotting shows immunoprecipitated endogenous HIC1 and STAT3 from the nuclear extracts of WI38 cells (left panel) or WI38 cells starved for 24 h and followed by treatment of 20 ng/ml OSM for 30 min (right panel). Input represents the 10% amount of nuclear extracts subjected to immunoprecipitation. (D) Immunoblotting analysis of in vitro-synthesized HIC1 protein pulled down by recombinant GST-STAT3 fusion proteins (top panel). Input represents 5% of the reticulocyte lysates containing synthesized HIC1 protein subjected to binding assays. Coomassie blue staining showing the levels of GST and GST-STAT3 fusion proteins used in each sample (bottom). The asterisks depict GST and GST-STAT3 proteins.
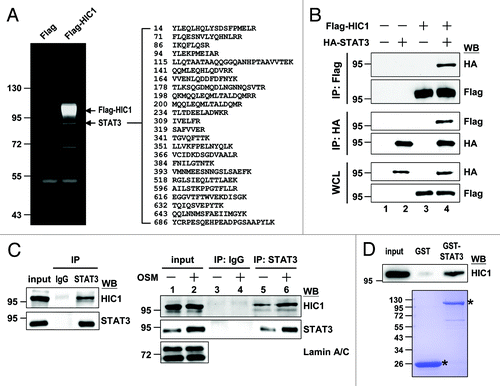
Figure 1. HIC1 interacts with STAT3 in vivo and in vitro. (A) SYPRO Ruby gel shows STAT3 pulled down from the cell lysates of 293T cells expressing Flag-tagged HIC1 by immunoprecipitation with anti-Flag antibody. STAT3 peptides detected by mass spectrometry are indicated. (B) Western blots show complex formation of Flag-HIC1 and HA-STAT3 in HeLa cells by immunoprecipitation with indicated antibodies. IP, immunoprecipitation; WCL, whole cell lysates; WB, western blotting (C) Immunoblotting shows immunoprecipitated endogenous HIC1 and STAT3 from the nuclear extracts of WI38 cells (left panel) or WI38 cells starved for 24 h and followed by treatment of 20 ng/ml OSM for 30 min (right panel). Input represents the 10% amount of nuclear extracts subjected to immunoprecipitation. (D) Immunoblotting analysis of in vitro-synthesized HIC1 protein pulled down by recombinant GST-STAT3 fusion proteins (top panel). Input represents 5% of the reticulocyte lysates containing synthesized HIC1 protein subjected to binding assays. Coomassie blue staining showing the levels of GST and GST-STAT3 fusion proteins used in each sample (bottom). The asterisks depict GST and GST-STAT3 proteins.

Figure 2. HIC1 suppresses IL-6/STAT3-activated reporter activity. (A and B) Reporter gene activity of 293T cells transfected with 3xLy6E-Luc reporter and increasing amounts of HA-tagged HIC1 expression construct and then treated with IL-6 (20 ng/ml) for 16 h (A) or along with Flag-tagged STAT3-CA, a constitutively active form of STAT3, transfection for 36 h (B). Error bars represent the mean ± SD (n = 3)
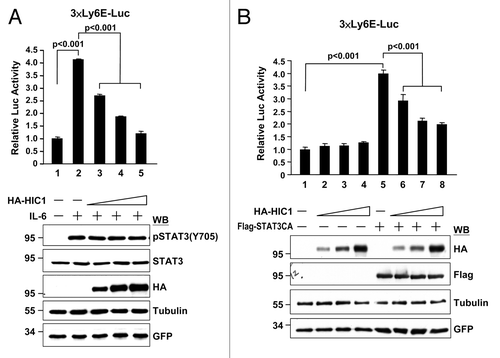
Figure 2. HIC1 suppresses IL-6/STAT3-activated reporter activity. (A and B) Reporter gene activity of 293T cells transfected with 3xLy6E-Luc reporter and increasing amounts of HA-tagged HIC1 expression construct and then treated with IL-6 (20 ng/ml) for 16 h (A) or along with Flag-tagged STAT3-CA, a constitutively active form of STAT3, transfection for 36 h (B). Error bars represent the mean ± SD (n = 3)

Figure 3. HIC1 represses the promoter activity and expression of VEGF and c-Myc genes and cell colony formation. (A) Reporter gene activity of MDA-MB 231 cells transfected with indicated shRNAs for 24 h and then transfected again with VEGF-Luc or c-Myc-Luc reporter and increasing amounts of pcDNA3-Flag-HIC1 for additional 36 h. Western blots show transfected Flag-HIC1 and endogenous STAT3 levels of each sample. Error bars represent the mean ± SD (n = 3) (B) Real-time qPCR analysis of endogenous STAT3 target gene VEGF and c-Myc mRNAs from HIC1 lentivirus infected MDA-MB 231 cells. Bar graph shows the relative expression of VEGF and c-Myc normalized to GAPDH (the sample with empty vector was taken as 1). Error bars represent the mean ± SD (n = 3) (C) Real-time qPCR analysis of VEGF and c-Myc mRNAs from WI-38 cells infected with lentivirus expressing HIC1 shRNAs for 24 h, serum starved for additional 24 h and then treated with OSM (20 ng/ml) for 2 h. Error bars represent the mean ± SD (n = 3). (D) Colony formation analysis of MDA-MB 231 cells infected with lentivirus expressing Flag-HIC1 and/or indicated shRNAs for 14 d culture with puromycin (2 μg/ml) selection and followed by crystal violet staining (top panel). Bar graph shows the quantification of colony formation of the MDA-MB-231 cells infected with indicated lentivirus. Error bars represent the mean ± SD (n = 3) (bottom panel).
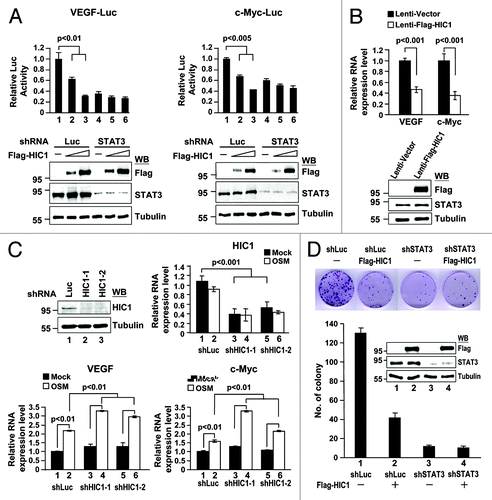
Figure 3. HIC1 represses the promoter activity and expression of VEGF and c-Myc genes and cell colony formation. (A) Reporter gene activity of MDA-MB 231 cells transfected with indicated shRNAs for 24 h and then transfected again with VEGF-Luc or c-Myc-Luc reporter and increasing amounts of pcDNA3-Flag-HIC1 for additional 36 h. Western blots show transfected Flag-HIC1 and endogenous STAT3 levels of each sample. Error bars represent the mean ± SD (n = 3) (B) Real-time qPCR analysis of endogenous STAT3 target gene VEGF and c-Myc mRNAs from HIC1 lentivirus infected MDA-MB 231 cells. Bar graph shows the relative expression of VEGF and c-Myc normalized to GAPDH (the sample with empty vector was taken as 1). Error bars represent the mean ± SD (n = 3) (C) Real-time qPCR analysis of VEGF and c-Myc mRNAs from WI-38 cells infected with lentivirus expressing HIC1 shRNAs for 24 h, serum starved for additional 24 h and then treated with OSM (20 ng/ml) for 2 h. Error bars represent the mean ± SD (n = 3). (D) Colony formation analysis of MDA-MB 231 cells infected with lentivirus expressing Flag-HIC1 and/or indicated shRNAs for 14 d culture with puromycin (2 μg/ml) selection and followed by crystal violet staining (top panel). Bar graph shows the quantification of colony formation of the MDA-MB-231 cells infected with indicated lentivirus. Error bars represent the mean ± SD (n = 3) (bottom panel).

Figure 4. HIC1 attenuates the DNA binding activity of STAT3. (A) Western blot analysis of STAT3 phosphorylation in MDA-MB 231 cells infected with lentivirus expressing Flag-tagged HIC1. (B) Western blotting shows STAT3 phosphorylation, acetylation, and nuclear translocation in MCF7 cells transfected with Flag-HIC1, serum starved for 24 h and then treated with OSM (20 ng/ml; 30 min). Tubulin and lamin A/C were used as loading controls for cytosolic and nuclear fractions, respectively. (C) Phosphoimager analysis of the EMSA gel showing 32P-labeled SIE oligonucleotide with nuclear extracts from 293T cells transfected with HA-STAT3 along with or without increasing amounts of Flag-HIC1 and treated with OSM (20 ng/ml; 30 min) or incubated with anti-STAT3 for supershift as indicated. Western blots show the levels of indicated proteins in the nuclear extracts of each sample for EMSA (bottom). The intensity of STAT3/SIE complex was quantified by densitometry and the relative binding of STAT3 to SIE is indicated after normalization to the sample with OSM treatment but without Flag-HIC1 transfection taken as 1. (D) ChIP semi-quantitative and real-time qPCR analyses of MDA-MB 231 cells infected with lentivirus expressing Flag-tagged HIC1. ChIP assays were performed using indicated antibodies, and PCR was performed with primers specific for a region encompassed the STAT3 or Sp1 binding site in the promoter regions of c-Myc and VEGF genes. The semi-quantitative PCR products were resolved on 1.5% agarose gel (top panel). Bar graph shows the ChIP real-time qPCR data with anti-STAT3 or control antibody (bottom panel). Error bars, standard deviation; n = 3. “Input” represents 1% of the chromatin used for the immunoprecipitation with indicated antibodies. (E) ChIP real-time qPCR analyses of WI38 cells infected with lentivirus expressing shHIC1 for 24 h, serum starved for additional 24 h and then treated with OSM (20 ng/ml; 30 min). ChIP assays were performed using anti-STAT3 antibody and qPCR was performed with primers specific for a region encompassed the STAT3 binding site in the promoter regions of c-Myc and VEGF genes or for the exon region of GAPDH as a negative control. Error bars, standard deviation; n = 3. “Input” represents 1% of the chromatin used for the immunoprecipitation with anti-STAT3 antibody.
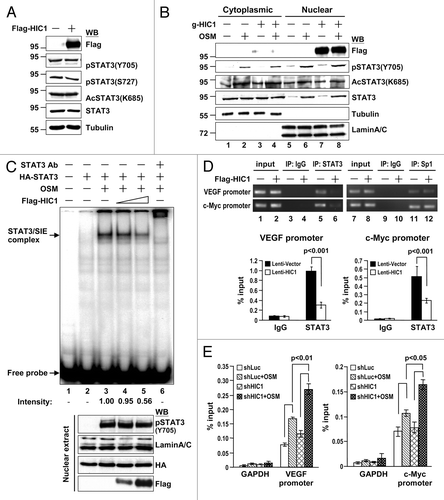
Figure 4. HIC1 attenuates the DNA binding activity of STAT3. (A) Western blot analysis of STAT3 phosphorylation in MDA-MB 231 cells infected with lentivirus expressing Flag-tagged HIC1. (B) Western blotting shows STAT3 phosphorylation, acetylation, and nuclear translocation in MCF7 cells transfected with Flag-HIC1, serum starved for 24 h and then treated with OSM (20 ng/ml; 30 min). Tubulin and lamin A/C were used as loading controls for cytosolic and nuclear fractions, respectively. (C) Phosphoimager analysis of the EMSA gel showing 32P-labeled SIE oligonucleotide with nuclear extracts from 293T cells transfected with HA-STAT3 along with or without increasing amounts of Flag-HIC1 and treated with OSM (20 ng/ml; 30 min) or incubated with anti-STAT3 for supershift as indicated. Western blots show the levels of indicated proteins in the nuclear extracts of each sample for EMSA (bottom). The intensity of STAT3/SIE complex was quantified by densitometry and the relative binding of STAT3 to SIE is indicated after normalization to the sample with OSM treatment but without Flag-HIC1 transfection taken as 1. (D) ChIP semi-quantitative and real-time qPCR analyses of MDA-MB 231 cells infected with lentivirus expressing Flag-tagged HIC1. ChIP assays were performed using indicated antibodies, and PCR was performed with primers specific for a region encompassed the STAT3 or Sp1 binding site in the promoter regions of c-Myc and VEGF genes. The semi-quantitative PCR products were resolved on 1.5% agarose gel (top panel). Bar graph shows the ChIP real-time qPCR data with anti-STAT3 or control antibody (bottom panel). Error bars, standard deviation; n = 3. “Input” represents 1% of the chromatin used for the immunoprecipitation with indicated antibodies. (E) ChIP real-time qPCR analyses of WI38 cells infected with lentivirus expressing shHIC1 for 24 h, serum starved for additional 24 h and then treated with OSM (20 ng/ml; 30 min). ChIP assays were performed using anti-STAT3 antibody and qPCR was performed with primers specific for a region encompassed the STAT3 binding site in the promoter regions of c-Myc and VEGF genes or for the exon region of GAPDH as a negative control. Error bars, standard deviation; n = 3. “Input” represents 1% of the chromatin used for the immunoprecipitation with anti-STAT3 antibody.

Figure 5. Interaction domain mapping of HIC1 and STAT3 (A) Schematic presentation of STAT3 domains and deletion mutants used in this study. The interaction of each STAT3 deletion mutant with HIC1 is indicated (top panel). Western blots show immunoprecipitation of 293T cells expressing HA-tagged STAT3 deletion mutants and Flag-tagged HIC1 with anti-HA antibody (bottom panel). (B) Schematic presentation of HIC1 domains and deletion mutants used in this study. The interaction of each HIC1 deletion mutant with STAT3 is indicated. BTB, BTB-POZ domain; CR, central region; ZF, zinc finger domain. Western blots show the immunoprecipitation of 293T cells expressing HA-tagged HIC1 deletion mutants and STAT3 by anti-HA or STAT3 antibody. (C) Phosphoimager analysis of the EMSA gel showing 32P-labeled SIE oligonucleotide with nuclear extracts from 293T cells transfected with HA-STAT3 and treated with OSM (20 ng/ml; 30 min) incubated with in vitro-synthesized HIC1 wild-type or (1–420) mutant fragment proteins or anti-STAT3 for supershift as indicated. The western blot shows the levels of indicated proteins added to the nuclear extracts for EMSA (input). The intensity of STAT3/SIE complex was quantified by densitometry and the relative binding of STAT3 to SIE is indicated after normalization to the sample with OSM treatment taken as 1.
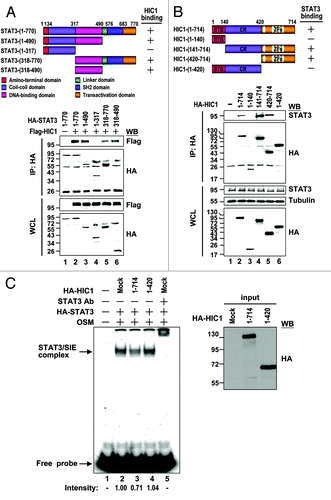
Figure 5. Interaction domain mapping of HIC1 and STAT3 (A) Schematic presentation of STAT3 domains and deletion mutants used in this study. The interaction of each STAT3 deletion mutant with HIC1 is indicated (top panel). Western blots show immunoprecipitation of 293T cells expressing HA-tagged STAT3 deletion mutants and Flag-tagged HIC1 with anti-HA antibody (bottom panel). (B) Schematic presentation of HIC1 domains and deletion mutants used in this study. The interaction of each HIC1 deletion mutant with STAT3 is indicated. BTB, BTB-POZ domain; CR, central region; ZF, zinc finger domain. Western blots show the immunoprecipitation of 293T cells expressing HA-tagged HIC1 deletion mutants and STAT3 by anti-HA or STAT3 antibody. (C) Phosphoimager analysis of the EMSA gel showing 32P-labeled SIE oligonucleotide with nuclear extracts from 293T cells transfected with HA-STAT3 and treated with OSM (20 ng/ml; 30 min) incubated with in vitro-synthesized HIC1 wild-type or (1–420) mutant fragment proteins or anti-STAT3 for supershift as indicated. The western blot shows the levels of indicated proteins added to the nuclear extracts for EMSA (input). The intensity of STAT3/SIE complex was quantified by densitometry and the relative binding of STAT3 to SIE is indicated after normalization to the sample with OSM treatment taken as 1.

Figure 6. HIC1 C-terminal domain is important to suppress VEGF and c-Myc gene expression and cell growth (A) Reporter gene activity of MDA-MB 231 cells transfected with indicated reporter along with increasing amounts of HIC1 WT or (1–420) mutant. Error bars represent the mean ± SD (n = 3). Western blots show the expression levels of HIC1 WT and (1–420) mutant in samples. (B) Real-time qPCR and western analyses of VEGF and c-Myc mRNAs and protein levels from MDA-MB 231 cells infected with lentivirus expressing Flag-tagged HIC1 WT or (1–420) mutant. Error bars represent the mean ± SD (n = 3). (C) Cell growth analysis of MDA-MB 231 cells infected with indicated lentivirus expression constructs for 24 h and incubated for 5 d and followed by MTT assays. Error bars represent the mean ± SD (n = 3).
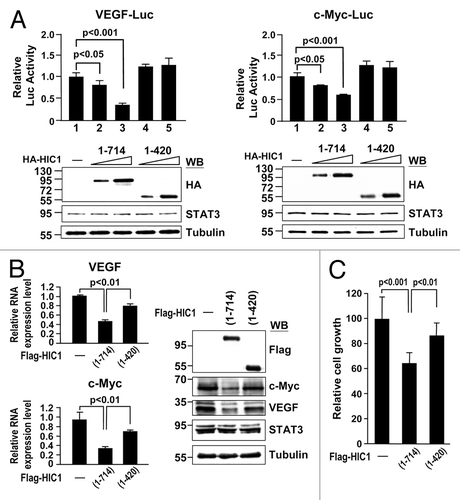
Figure 6. HIC1 C-terminal domain is important to suppress VEGF and c-Myc gene expression and cell growth (A) Reporter gene activity of MDA-MB 231 cells transfected with indicated reporter along with increasing amounts of HIC1 WT or (1–420) mutant. Error bars represent the mean ± SD (n = 3). Western blots show the expression levels of HIC1 WT and (1–420) mutant in samples. (B) Real-time qPCR and western analyses of VEGF and c-Myc mRNAs and protein levels from MDA-MB 231 cells infected with lentivirus expressing Flag-tagged HIC1 WT or (1–420) mutant. Error bars represent the mean ± SD (n = 3). (C) Cell growth analysis of MDA-MB 231 cells infected with indicated lentivirus expression constructs for 24 h and incubated for 5 d and followed by MTT assays. Error bars represent the mean ± SD (n = 3).

Reprints and Corporate Permissions

Please note: Selecting permissions does not provide access to the full text of the article, please see our help page How do I view content?

To request a reprint or corporate permissions for this article, please click on the relevant link below:

Academic Permissions

Please note: Selecting permissions does not provide access to the full text of the article, please see our help page How do I view content?

Obtain permissions instantly via Rightslink by clicking on the button below:

If you are unable to obtain permissions via Rightslink, please complete and submit this Permissions form. For more information, please visit our Permissions help page.