973
Views
23
CrossRef citations to date
0
Altmetric
Report

SEPT9_i1 is required for the association between HIF-1α and importin-α to promote efficient nuclear translocation

&
Pages 2297-2308 | Received 23 Mar 2013, Accepted 12 Jun 2013, Published online: 21 Jun 2013

Figures & data

Figure 1. Expression of SEPT9_i1 N25 polypeptide inhibits HIF-1 transcriptional activity. (A) SEPT9 isoform 1 (SEPT9_i1) unique N25 sequence is outlined and the putative bipartite NLS is marked in bold. (B) HEK 293T cells were transiently cotransfected with increasing amounts of Flag-tagged N25 or empty vector (EV) with vector-expressing luciferase under the control of HRE. After 24 h of transfection, the cells were subjected overnight to normoxia or hypoxia and then analyzed by luciferase luminescence assay. Relative luciferase activity, units/μg protein at each assay point. Normoxia results are presented in the inset. Columns, mean (n = 3); bars, SD *p < 0.05 compared with hypoxia of EV. (C) PC-3 cells transiently transfected with Flag-N25 or EV. After 24 h of transfection, the cells were subjected overnight to normoxia or hypoxia and nuclear extracts were then prepared and analyzed for HRE binding using TansFac kit. Activity (O.D.) was normalized to the protein amount at each assay point (O.D./µg protein). Columns, mean (n = 3); bars, SD; *P < 0.05 compared with normoxia and hypoxia of EV, respectively. (D) HEK 293T cells were transiently cotransfected with Flag-N25 or GFP-tagged N25 and their respective EVs together with the HRE-luciferase reporter plasmid. After 24 h, the cells were subjected overnight to hypoxia. Relative luciferase activity (RLU) units/mg protein at each assay point was normalized (%) to the respective EV. Columns, mean (n = 3); bars, SD; *P < 0.05 compared with EV.
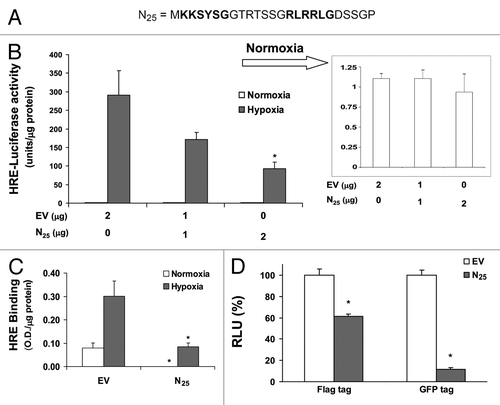
Figure 1. Expression of SEPT9_i1 N25 polypeptide inhibits HIF-1 transcriptional activity. (A) SEPT9 isoform 1 (SEPT9_i1) unique N25 sequence is outlined and the putative bipartite NLS is marked in bold. (B) HEK 293T cells were transiently cotransfected with increasing amounts of Flag-tagged N25 or empty vector (EV) with vector-expressing luciferase under the control of HRE. After 24 h of transfection, the cells were subjected overnight to normoxia or hypoxia and then analyzed by luciferase luminescence assay. Relative luciferase activity, units/μg protein at each assay point. Normoxia results are presented in the inset. Columns, mean (n = 3); bars, SD *p < 0.05 compared with hypoxia of EV. (C) PC-3 cells transiently transfected with Flag-N25 or EV. After 24 h of transfection, the cells were subjected overnight to normoxia or hypoxia and nuclear extracts were then prepared and analyzed for HRE binding using TansFac kit. Activity (O.D.) was normalized to the protein amount at each assay point (O.D./µg protein). Columns, mean (n = 3); bars, SD; *P < 0.05 compared with normoxia and hypoxia of EV, respectively. (D) HEK 293T cells were transiently cotransfected with Flag-N25 or GFP-tagged N25 and their respective EVs together with the HRE-luciferase reporter plasmid. After 24 h, the cells were subjected overnight to hypoxia. Relative luciferase activity (RLU) units/mg protein at each assay point was normalized (%) to the respective EV. Columns, mean (n = 3); bars, SD; *P < 0.05 compared with EV.

Figure 2. GFP position in N25 polypeptide was critical for inhibition of HIF-1 transcriptional activity. N25 was tagged with GFP on either its C terminus or N terminus using the retroviral vector pGFP1-N1 or pGFP1-C1, respectively. Together with their respective empty vectors (EVs), were infected into PC-3 cells to stably express GFP-tagged N25 or GFP only. The cells were analyzed (A) by SDS-PAGE and immunoblotting with anti-GFP antibody or (B) by fluorescent microscopy (×40). (C) PC-3 cells expressing N25-GFP or (D) GFP-N25 and their respective EVs were transiently transfected with the HRE-luciferase reporter plasmid. After 24 h, the cells were subjected overnight to hypoxia or normoxia. Columns, mean (n = 3); bars, SD; *P < 0.05 compared with EV. Normoxia results are presented in the inset. (E) PC-3 cell stably expressing GFP-tagged N25 were grown under normoxia or hypoxia. After 16 h, cells were harvested and whole cellular extracts were prepared, analyzed by SDS-PAGE, and immunoblotted with antibodies to HIF1α, GFP, and tubulin.
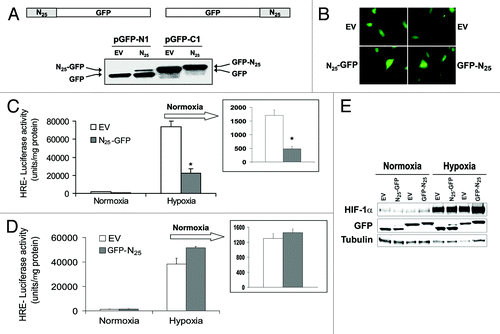
Figure 2. GFP position in N25 polypeptide was critical for inhibition of HIF-1 transcriptional activity. N25 was tagged with GFP on either its C terminus or N terminus using the retroviral vector pGFP1-N1 or pGFP1-C1, respectively. Together with their respective empty vectors (EVs), were infected into PC-3 cells to stably express GFP-tagged N25 or GFP only. The cells were analyzed (A) by SDS-PAGE and immunoblotting with anti-GFP antibody or (B) by fluorescent microscopy (×40). (C) PC-3 cells expressing N25-GFP or (D) GFP-N25 and their respective EVs were transiently transfected with the HRE-luciferase reporter plasmid. After 24 h, the cells were subjected overnight to hypoxia or normoxia. Columns, mean (n = 3); bars, SD; *P < 0.05 compared with EV. Normoxia results are presented in the inset. (E) PC-3 cell stably expressing GFP-tagged N25 were grown under normoxia or hypoxia. After 16 h, cells were harvested and whole cellular extracts were prepared, analyzed by SDS-PAGE, and immunoblotted with antibodies to HIF1α, GFP, and tubulin.

Figure 3. Mutation in the N25-GFP NLS (N25*-GFP) abrogates its inhibition on HIF-1 transcriptional activity. (A) N25-GFP NLS residue was mutated by side directed mutagenesis as indicated. (B) The N25*-GFP expression was analyzed by SDS-PAGE, and immunoblotted with antibody to GFP, HIF-1α, and tubulin. (C) Mutated N25*-GFP was infected into PC-3 cells. The stably infected PC-3 cells were transiently transfected with a plasmid expressing luciferase under the control of HRE and grown under normoxia and hypoxia. Relative luciferase activity was normalized to the protein amount at each assay point. Columns, mean (n = 3); bars, ± SD; *P < 0.05.
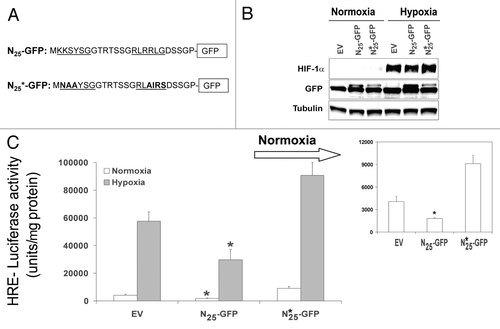
Figure 3. Mutation in the N25-GFP NLS (N25*-GFP) abrogates its inhibition on HIF-1 transcriptional activity. (A) N25-GFP NLS residue was mutated by side directed mutagenesis as indicated. (B) The N25*-GFP expression was analyzed by SDS-PAGE, and immunoblotted with antibody to GFP, HIF-1α, and tubulin. (C) Mutated N25*-GFP was infected into PC-3 cells. The stably infected PC-3 cells were transiently transfected with a plasmid expressing luciferase under the control of HRE and grown under normoxia and hypoxia. Relative luciferase activity was normalized to the protein amount at each assay point. Columns, mean (n = 3); bars, ± SD; *P < 0.05.

Figure 4. Expression of N25-GFP decreased proliferation, tumor growth and angiogenesis. (A) PC-3 cells stably expressing N25-GFP or empty vector (EV) were grown in 96-well plates and analyzed for XTT proliferation assay. Proliferation was expressed as increase in percentage of the initial absorbance that was measured 24 h after seeding (100%). Growth media were not changed until the end of the experiment. Points, mean (n = 6); bars, SD; *P < 0.001. (B) PC-3 cells stably expressing N25-GFP or EV were implanted (2 x 10⁶) subcutaneously into the hinds of athymic nude mice. Tumor volume was monitored. Points, mean (n = 7 EV, n = 9 N25); bars, SE; *P < 0.05. (C) Tumor sections from EV and N25 tumors were stained with H&E (×20; upper panels) and immunostained with anti-CD34 (×20; middle panels) and anti-Ki67 (×40; lower panels). (D) Microvessel density (MVD) was determined in 5 paraffin-embedded tumor sections from each animal per group. Columns, average of the means of MVD from each animal; bars, SE; *P = 0.03. (E) Ki67 staining (%) was quantified by dividing the number of positive nuclei by the number of total nuclei in a ×40 magnification field multiplied by 100. Samples consisted from 5 paraffin-embedded tumor sections from each animal per group. Columns, average of the means of Ki67 staining from each animal; bars, SE; *P < 0.001. (F) Protein extracts were purified from xenograft tumors of each group and analyzed by western blotting using antibodies to HIF-1α, GFP, and actin. (G) Total RNA was isolated from 4 representative xenograft tumors of each group and analyzed by quantitative real-time PCR using primers specific to HIF-1α, Glut-1, ET-1, and VEGF. The results were normalized to actin mRNA expression levels, and the mean induction of each gene was normalized to EV. Columns, mean (n = 2); bars, SD; *P < 0.05.
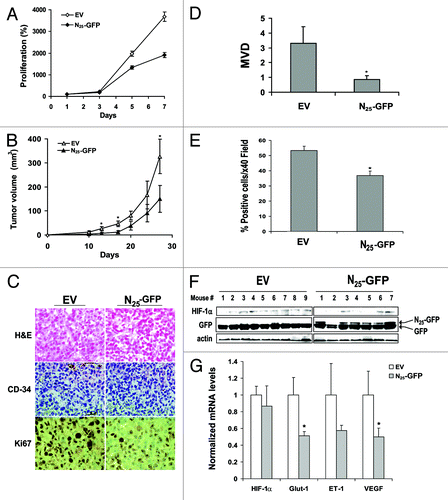
Figure 4. Expression of N25-GFP decreased proliferation, tumor growth and angiogenesis. (A) PC-3 cells stably expressing N25-GFP or empty vector (EV) were grown in 96-well plates and analyzed for XTT proliferation assay. Proliferation was expressed as increase in percentage of the initial absorbance that was measured 24 h after seeding (100%). Growth media were not changed until the end of the experiment. Points, mean (n = 6); bars, SD; *P < 0.001. (B) PC-3 cells stably expressing N25-GFP or EV were implanted (2 x 10⁶) subcutaneously into the hinds of athymic nude mice. Tumor volume was monitored. Points, mean (n = 7 EV, n = 9 N25); bars, SE; *P < 0.05. (C) Tumor sections from EV and N25 tumors were stained with H&E (×20; upper panels) and immunostained with anti-CD34 (×20; middle panels) and anti-Ki67 (×40; lower panels). (D) Microvessel density (MVD) was determined in 5 paraffin-embedded tumor sections from each animal per group. Columns, average of the means of MVD from each animal; bars, SE; *P = 0.03. (E) Ki67 staining (%) was quantified by dividing the number of positive nuclei by the number of total nuclei in a ×40 magnification field multiplied by 100. Samples consisted from 5 paraffin-embedded tumor sections from each animal per group. Columns, average of the means of Ki67 staining from each animal; bars, SE; *P < 0.001. (F) Protein extracts were purified from xenograft tumors of each group and analyzed by western blotting using antibodies to HIF-1α, GFP, and actin. (G) Total RNA was isolated from 4 representative xenograft tumors of each group and analyzed by quantitative real-time PCR using primers specific to HIF-1α, Glut-1, ET-1, and VEGF. The results were normalized to actin mRNA expression levels, and the mean induction of each gene was normalized to EV. Columns, mean (n = 2); bars, SD; *P < 0.05.

Table 1. MVD analysis of tumors with equal volume derived from N25-GFP cells and control cells

Figure 5. N25-GFP reduced HIF-1α nuclear translocation. (A) PC-3 cells stably expressing N25-GFP and GFP-N25 and their empty vectors (EVs), pGFP-N1 and pGFP-C1, respectively, were grown under normoxia (N) or hypoxia (H) for 4 h. Nuclear and cytosolic extracts were then prepared, analyzed by SDS-PAGE, and immunoblotted with antibodies to HIF-1α,Topo-I and actin, respectively. PC-3 cells stably expressing N25-GFP and the corresponding EV were exposed to 6 h hypoxia in the presence or absence of 20 nM leptomycin B (LMB). Cells were either (B) subjected to nuclear and cytosolic extracts preparation and analysis by immunoblotting with antibodies to HIF-1 α, Topo-I and actin, respectively or (C) fixed and processed for immunofluorescence labeling with anti-HIF-1α antibody (red) and DAPI (blue). Staining was analyzed by confocal fluorescence microscope (magnification ×63). Lower panel, densitometric quantification of HIF-1α fluorescent signal of each cell from 4 different fields. The mean of nuclear/cytosolic ratio was plotted against the different conditions. *P < 0.001 N25-GFP compared with corresponding EV; **P < 0.01 LMB compared with no LMB. (D) PC-3 cells stably expressing N25-GFP, mutated N25*-GFP or empty vector (EV) were exposed to 6 h hypoxia in the presence of 20 nM LMB. Cells were processed for immunofluorescence as in (C) (magnification ×63).
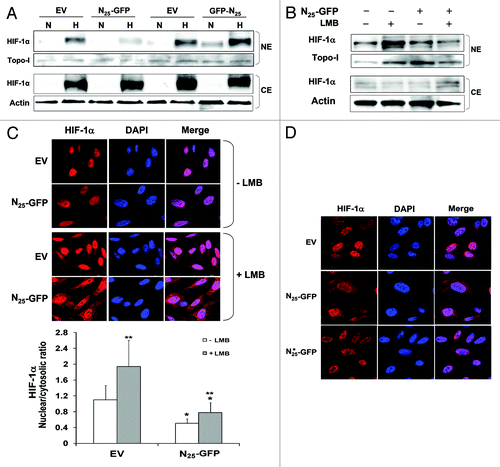
Figure 5. N25-GFP reduced HIF-1α nuclear translocation. (A) PC-3 cells stably expressing N25-GFP and GFP-N25 and their empty vectors (EVs), pGFP-N1 and pGFP-C1, respectively, were grown under normoxia (N) or hypoxia (H) for 4 h. Nuclear and cytosolic extracts were then prepared, analyzed by SDS-PAGE, and immunoblotted with antibodies to HIF-1α,Topo-I and actin, respectively. PC-3 cells stably expressing N25-GFP and the corresponding EV were exposed to 6 h hypoxia in the presence or absence of 20 nM leptomycin B (LMB). Cells were either (B) subjected to nuclear and cytosolic extracts preparation and analysis by immunoblotting with antibodies to HIF-1 α, Topo-I and actin, respectively or (C) fixed and processed for immunofluorescence labeling with anti-HIF-1α antibody (red) and DAPI (blue). Staining was analyzed by confocal fluorescence microscope (magnification ×63). Lower panel, densitometric quantification of HIF-1α fluorescent signal of each cell from 4 different fields. The mean of nuclear/cytosolic ratio was plotted against the different conditions. *P < 0.001 N25-GFP compared with corresponding EV; **P < 0.01 LMB compared with no LMB. (D) PC-3 cells stably expressing N25-GFP, mutated N25*-GFP or empty vector (EV) were exposed to 6 h hypoxia in the presence of 20 nM LMB. Cells were processed for immunofluorescence as in (C) (magnification ×63).

Figure 6. N25 manipulated HIF-1 α and SEPT9_i1 interactions with importin-α. (A) HEK 293T cells were cotransfected with Flag-HIF-1α and Flag-SEPT9_i1 or empty vector (EV). Whole cellular extracts were prepared and subjected to immunoprecipitation (IP) with anti-importin-α and immunoblotted (IB) with antibodies to Flag and importin-α. NS, nonspecific. (B) HEK 293T cells were transiently cotransfected with expression vectors encoding Flag-tagged full-length SEPT9_i1 and increasing amounts of N25-GFP complemented with pGFP-N1 EV to total 1.5 μg DNA/sample, or with Flag-SEPT9_i1-∆N25 (∆N25; lacking N25). After 48 h, whole cellular extracts were prepared and subjected to IP using anti-importin-α antibody (Ab) and then IB with Ab to Flag, importin-α and GFP. None, no immunoprecipitation, whole cellular extract only (input). (C) PC-3 cells stably expressing N25-GFP or EV, were grown under normoxia or hypoxia for 6 h, and then whole cellular extracts were prepared and subjected to immunoprecipitation (IP) using anti-importin-α antibody and then IB with Ab to HIF-1α and importin-α. (D) Flag-HIF-1α constructs, full-length (FL), amino acids 1–327, amino acids 531–826 or EV were expressed in HEK 293T cells and subjected to IP with Ab to importin-α and IB with Ab to Flag and importin-α.
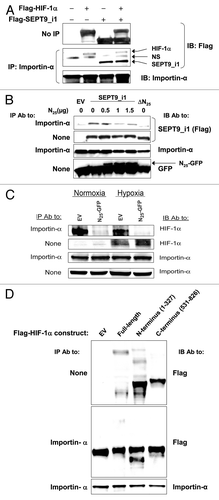
Figure 6. N25 manipulated HIF-1 α and SEPT9_i1 interactions with importin-α. (A) HEK 293T cells were cotransfected with Flag-HIF-1α and Flag-SEPT9_i1 or empty vector (EV). Whole cellular extracts were prepared and subjected to immunoprecipitation (IP) with anti-importin-α and immunoblotted (IB) with antibodies to Flag and importin-α. NS, nonspecific. (B) HEK 293T cells were transiently cotransfected with expression vectors encoding Flag-tagged full-length SEPT9_i1 and increasing amounts of N25-GFP complemented with pGFP-N1 EV to total 1.5 μg DNA/sample, or with Flag-SEPT9_i1-∆N25 (∆N25; lacking N25). After 48 h, whole cellular extracts were prepared and subjected to IP using anti-importin-α antibody (Ab) and then IB with Ab to Flag, importin-α and GFP. None, no immunoprecipitation, whole cellular extract only (input). (C) PC-3 cells stably expressing N25-GFP or EV, were grown under normoxia or hypoxia for 6 h, and then whole cellular extracts were prepared and subjected to immunoprecipitation (IP) using anti-importin-α antibody and then IB with Ab to HIF-1α and importin-α. (D) Flag-HIF-1α constructs, full-length (FL), amino acids 1–327, amino acids 531–826 or EV were expressed in HEK 293T cells and subjected to IP with Ab to importin-α and IB with Ab to Flag and importin-α.

Figure 7. SEPT9_i1 knockdown decreased HIF-1α interaction with importin-α and its nuclear translocation. (A) PC-3 cells stably expressing shSEPT9_v1 or control EV were treated or untreated with 10 μM MG-132 and exposed to hypoxia or normoxia for 6 h. Whole cellular extracts were prepared and subjected to immunoprecipitation (IP) using antibody (Ab) to importin-α and immunoblotted (IB) with Ab to HIF-1α, importin-α, SEPT9_i1 and tubulin. None, no immunoprecipitation, whole cellular extract only (input). (B) PC-3 cells stably expressing shSEPT9_v1 or EV were seeded on cover glasses, exposed to 6 h hypoxia in the presence of 20 nM of LMB. Cells were processed for immunofluorescence labeling with HIF-1α Ab (red staining) and DAPI. Staining was analyzed by confocal fluorescence microscopy (magnification ×40). Lower panel, densitometric quantification of HIF-1α fluorescent signal of each cell from 4 different fields. The mean of nuclear/cytosolic ratio was plotted against the different conditions. *P = 0.001 shSEPT9_v1 compared with EV.
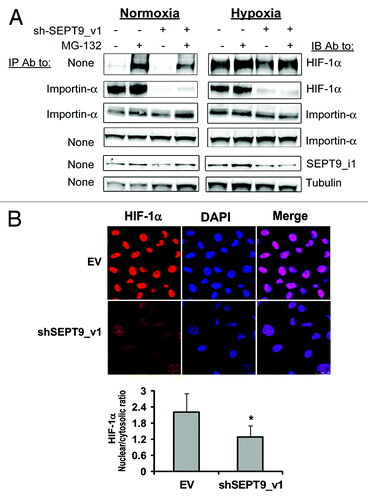
Figure 7. SEPT9_i1 knockdown decreased HIF-1α interaction with importin-α and its nuclear translocation. (A) PC-3 cells stably expressing shSEPT9_v1 or control EV were treated or untreated with 10 μM MG-132 and exposed to hypoxia or normoxia for 6 h. Whole cellular extracts were prepared and subjected to immunoprecipitation (IP) using antibody (Ab) to importin-α and immunoblotted (IB) with Ab to HIF-1α, importin-α, SEPT9_i1 and tubulin. None, no immunoprecipitation, whole cellular extract only (input). (B) PC-3 cells stably expressing shSEPT9_v1 or EV were seeded on cover glasses, exposed to 6 h hypoxia in the presence of 20 nM of LMB. Cells were processed for immunofluorescence labeling with HIF-1α Ab (red staining) and DAPI. Staining was analyzed by confocal fluorescence microscopy (magnification ×40). Lower panel, densitometric quantification of HIF-1α fluorescent signal of each cell from 4 different fields. The mean of nuclear/cytosolic ratio was plotted against the different conditions. *P = 0.001 shSEPT9_v1 compared with EV.

Figure 8. A proposed model for SEPT9_i1-importin-α in HIF-1α nuclear translocation. SEPT9_i1 interacts with both HIF-1α and importin-α to drive HIF-1α nuclear translocation. The interaction between SEPT9_i1 and importin-α is mediated by SEPT9_i1 N25 depending on its NLS sequence. When N25 is overexpressed it competes with the full-length SEPT9_i1 for binding importin-α. As a consequence HIF-1α translocation to the nucleus is impaired. IMP-α, importin-α; NLS, nuclear localization signal.
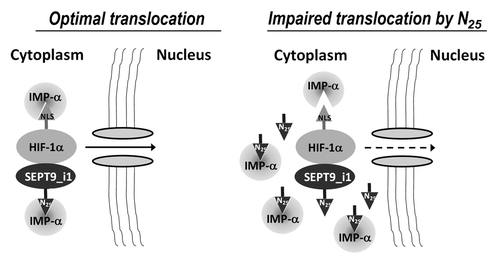
Figure 8. A proposed model for SEPT9_i1-importin-α in HIF-1α nuclear translocation. SEPT9_i1 interacts with both HIF-1α and importin-α to drive HIF-1α nuclear translocation. The interaction between SEPT9_i1 and importin-α is mediated by SEPT9_i1 N25 depending on its NLS sequence. When N25 is overexpressed it competes with the full-length SEPT9_i1 for binding importin-α. As a consequence HIF-1α translocation to the nucleus is impaired. IMP-α, importin-α; NLS, nuclear localization signal.
Supplemental material

Additional material

Download Zip (396.5 KB)

Reprints and Corporate Permissions

Please note: Selecting permissions does not provide access to the full text of the article, please see our help page How do I view content?

To request a reprint or corporate permissions for this article, please click on the relevant link below:

Academic Permissions

Please note: Selecting permissions does not provide access to the full text of the article, please see our help page How do I view content?

Obtain permissions instantly via Rightslink by clicking on the button below:

If you are unable to obtain permissions via Rightslink, please complete and submit this Permissions form. For more information, please visit our Permissions help page.