1,023
Views
27
CrossRef citations to date
0
Altmetric
Report

In vivo functional studies of tumor-specific retrogene NanogP8 in transgenic animals

, , , , , , , , & show all
Pages 2395-2408 | Received 21 Mar 2013, Accepted 13 Jun 2013, Published online: 26 Jun 2013

Figures & data

Figure 1. K14-NanogP8 transgenic animals and their gross phenotypes. (A) Schematic of the K14-NanogP8 transgene construct. The human K14 promoterCitation25 was used to drive the expression of NanogP8 cDNA cloned from the HPCa5 primary prostate tumor.Citation14 A ~600 bp rabbit β-globin intron 2 (In2) sequence was used to promote correct transgene processing and expression.Citation23-Citation25 Restriction enzyme sites are indicated. (B) An example of PCR genotyping using genomic DNA from ear punches. The positive ~300 bp transgene band was detected using the forward primer located in the b-globin intron and reverse primer in the NanogP8 cDNA. Genomic b-casein PCR was used as internal control. (C) Epidermal lysate from one-day old WT and L1 Tg animals was used in western blotting analysis of NanogP8 with an anti-human Nanog Ab (#3580, Cell Signaling, Table S1). Animal numbers are indicated on top. Animals 1211, 1214, and 1215 were Tg animals and all the rest were non-Tg animals (verified by genotyping). (D) Western blotting of NanogP8 in adult L1 Tg mouse tissues. Whole-cell lysate prepared from 3-mo-old L1 Tg animal tissues/organs as indicated (f. stomach, forestomach; sm. int., small intestine) was used in western blotting as above. The arrow points to the ~42-kD NanogP8 band and the asterisk indicates the ~35 kD band seen in the liver, kidney, and prostate. The blot was reprobed for β-actin (lower panel). (E) Whole-cell lysate prepared from tissues in a 3-mo old L1 Tg animal was used in western blotting of NanogP8 and the blot was reprobed for β-actin. (F) Whole-cell lysate prepared from L1 (6 mo old) and L3 (4-mo-old) Tg epidermis was used in western blotting of NanogP8. Note that the L1 Tg epidermis expressed the highest NanogP8 protein and the L3 animals (animal numbers indicated) that had cataracts (catar.) expressed higher levels of NanogP8 than the ones that did not. (G) Adult mouse tissues expressed little or only low levels of endogenous mouse Nanog (mNanog) protein. Whole-cell lysate from the indicated tissues of a 3-mo-old WT mouse was used in western blotting with an antibody specific for mouse Nanog (Abcam, #70482; Table S1). Human embryonal carcinoma (N-tera) cells were used as a “negative” control. (H) Litter sizes in the WT and L1 F1 Tg animals. (I and J) Smaller body sizes of the L1 Tg animals. Shown in I are images of two pairs of WT and L1 Tg animals at P5 and p14, respectively. Shown in (J) is quantitative presentation of body weight vs. age. Note that from wk 2 and onwards both Tg males and females are significantly smaller than the age- and sex-matched WT animals (P < 0.05; Student t test). (K) Gross animal hair phenotypes. (A-C) The L1 adult (3-mo) Tg mice have rough and sparse hair coat (B and C) compared with WT animal (A). (D and E) An example of curly whiskers in a L1 Tg animal (3 mo), which also showed ocular abnormalities. (F) A L3 Tg animal (4 mo) showing sparse hair coat and curly whiskers.
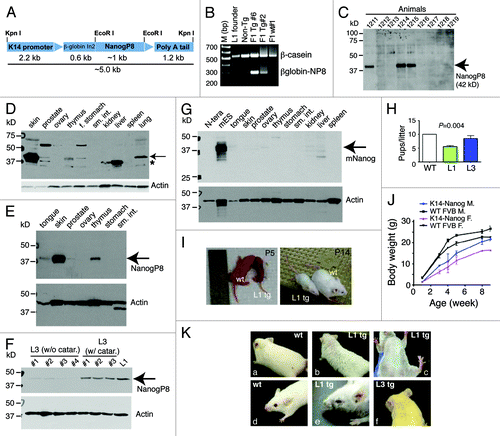
Figure 1. K14-NanogP8 transgenic animals and their gross phenotypes. (A) Schematic of the K14-NanogP8 transgene construct. The human K14 promoterCitation25 was used to drive the expression of NanogP8 cDNA cloned from the HPCa5 primary prostate tumor.Citation14 A ~600 bp rabbit β-globin intron 2 (In2) sequence was used to promote correct transgene processing and expression.Citation23-Citation25 Restriction enzyme sites are indicated. (B) An example of PCR genotyping using genomic DNA from ear punches. The positive ~300 bp transgene band was detected using the forward primer located in the b-globin intron and reverse primer in the NanogP8 cDNA. Genomic b-casein PCR was used as internal control. (C) Epidermal lysate from one-day old WT and L1 Tg animals was used in western blotting analysis of NanogP8 with an anti-human Nanog Ab (#3580, Cell Signaling, Table S1). Animal numbers are indicated on top. Animals 1211, 1214, and 1215 were Tg animals and all the rest were non-Tg animals (verified by genotyping). (D) Western blotting of NanogP8 in adult L1 Tg mouse tissues. Whole-cell lysate prepared from 3-mo-old L1 Tg animal tissues/organs as indicated (f. stomach, forestomach; sm. int., small intestine) was used in western blotting as above. The arrow points to the ~42-kD NanogP8 band and the asterisk indicates the ~35 kD band seen in the liver, kidney, and prostate. The blot was reprobed for β-actin (lower panel). (E) Whole-cell lysate prepared from tissues in a 3-mo old L1 Tg animal was used in western blotting of NanogP8 and the blot was reprobed for β-actin. (F) Whole-cell lysate prepared from L1 (6 mo old) and L3 (4-mo-old) Tg epidermis was used in western blotting of NanogP8. Note that the L1 Tg epidermis expressed the highest NanogP8 protein and the L3 animals (animal numbers indicated) that had cataracts (catar.) expressed higher levels of NanogP8 than the ones that did not. (G) Adult mouse tissues expressed little or only low levels of endogenous mouse Nanog (mNanog) protein. Whole-cell lysate from the indicated tissues of a 3-mo-old WT mouse was used in western blotting with an antibody specific for mouse Nanog (Abcam, #70482; Table S1). Human embryonal carcinoma (N-tera) cells were used as a “negative” control. (H) Litter sizes in the WT and L1 F1 Tg animals. (I and J) Smaller body sizes of the L1 Tg animals. Shown in I are images of two pairs of WT and L1 Tg animals at P5 and p14, respectively. Shown in (J) is quantitative presentation of body weight vs. age. Note that from wk 2 and onwards both Tg males and females are significantly smaller than the age- and sex-matched WT animals (P < 0.05; Student t test). (K) Gross animal hair phenotypes. (A-C) The L1 adult (3-mo) Tg mice have rough and sparse hair coat (B and C) compared with WT animal (A). (D and E) An example of curly whiskers in a L1 Tg animal (3 mo), which also showed ocular abnormalities. (F) A L3 Tg animal (4 mo) showing sparse hair coat and curly whiskers.

Figure 2. Skin phenotypes in P5 L1 Tg animals. (Aand B) H and E and Nanog IHC analysis in the skin of two P5 WT and L1 Tg animals. Nanog immunostaining was performed using anti-human Nanog Ab (R&D; Table S1). For (A), representative low (A–D; objective 10×) and high (E–H; objective 40×) magnification images are shown. For (B), all original magnifications were 200×. (C) Quantification of IFE thickness. Four pairs of P5 WT and L1 K14-NanogP8 animals (indicated on the x-axis) were subjected to IFE thickness quantification in which 25 randomly selected areas (in each animal) of IFE perpendicular to the basement membrane were measured by Aperio ScanScope. Shown are the mean ± SD *P < 0.05 (Student t test). (D) Quantification of dermal thickness. The same 4 pairs of P5 WT and L1 K14-NanogP8 animals were subjected to dermal thickness quantification in which 25 randomly selected positions (in each animal) of dermis through to the muscle layer (excluding the hypodermis) were measured by Aperio ScanScope. Shown are the mean ± SD #P < 0.001; *P = 0.05 (Student t test). (E and F) The P5 L1 Tg skin shows reduced sebocytes. Shown in (E) are PPARγ stained images (200×) and in (F) quantification of sebocytes. (G–I) The P5 L1 Tg IFE showed increased proliferation. Shown in (G) are representative images of Ki-67 immunostaining in pair 1 (left) and pair 2 (right) of WT and L1 Tg epidermis. Shown in (H) is the quantification of Ki-67+ cells (a total of 500 cells counted for each in pair 1). For (I), the total Ki-67+ nuclei were quantified using the Aperio nuclear analysis algorithm over a 3 mm epidermal length. P value is indicated. (J) Cytokeratin staining in the P5 WT and Tg skin. Note prominent hyperkeratosis in the Tg skin. Original magnifications, ×200.
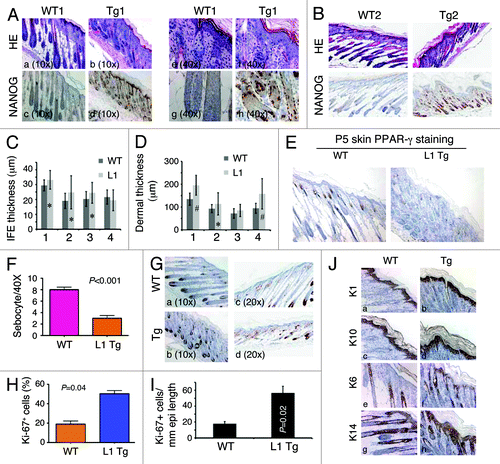
Figure 2. Skin phenotypes in P5 L1 Tg animals. (Aand B) H and E and Nanog IHC analysis in the skin of two P5 WT and L1 Tg animals. Nanog immunostaining was performed using anti-human Nanog Ab (R&D; Table S1). For (A), representative low (A–D; objective 10×) and high (E–H; objective 40×) magnification images are shown. For (B), all original magnifications were 200×. (C) Quantification of IFE thickness. Four pairs of P5 WT and L1 K14-NanogP8 animals (indicated on the x-axis) were subjected to IFE thickness quantification in which 25 randomly selected areas (in each animal) of IFE perpendicular to the basement membrane were measured by Aperio ScanScope. Shown are the mean ± SD *P < 0.05 (Student t test). (D) Quantification of dermal thickness. The same 4 pairs of P5 WT and L1 K14-NanogP8 animals were subjected to dermal thickness quantification in which 25 randomly selected positions (in each animal) of dermis through to the muscle layer (excluding the hypodermis) were measured by Aperio ScanScope. Shown are the mean ± SD #P < 0.001; *P = 0.05 (Student t test). (E and F) The P5 L1 Tg skin shows reduced sebocytes. Shown in (E) are PPARγ stained images (200×) and in (F) quantification of sebocytes. (G–I) The P5 L1 Tg IFE showed increased proliferation. Shown in (G) are representative images of Ki-67 immunostaining in pair 1 (left) and pair 2 (right) of WT and L1 Tg epidermis. Shown in (H) is the quantification of Ki-67+ cells (a total of 500 cells counted for each in pair 1). For (I), the total Ki-67+ nuclei were quantified using the Aperio nuclear analysis algorithm over a 3 mm epidermal length. P value is indicated. (J) Cytokeratin staining in the P5 WT and Tg skin. Note prominent hyperkeratosis in the Tg skin. Original magnifications, ×200.

Figure 3. Abnormal differentiation in the K14-NanogP8 Tg tongue epithelia. (A–D) Gross images of the P15 WT and L1 Tg tongue. A. Representative composite images of a P15 WT (top) and a P15 L1 Tg (bottom) tongue sections stained for H and E. The orientations of the sections were indicated: d, dorsal; v, ventral; l, lateral. (B and C) Enlarged composites showing the presence of differentiated filiform papillae in the WT tongue (B; arrowheads), which were lacking in the Tg tongue (C). (D) NanogP8 staining in the Tg tongue (original magnification, ×40). The WT tongue did not show NanogP8 staining (not shown). (E) Representative IHC images of P15 WT and L1 Tg tongue epithelium stained for Nanog, Ki-67, and K13. Arrows indicate increased numbers of K13-negative dermal papillae in the Tg tongue. Note that in WT epithelium the Ki-67 cells localized mainly to the base of retelike prominences (D, arrows) but in Tg epithelium the Ki-67 cells were often contiguous (C, black lines). (F) Representative H and E and Nanog IHC images from a pair of P17 WT and L1 Tg tongue epithelium. FP, fungiform papillae. Original magnifications, ×200.
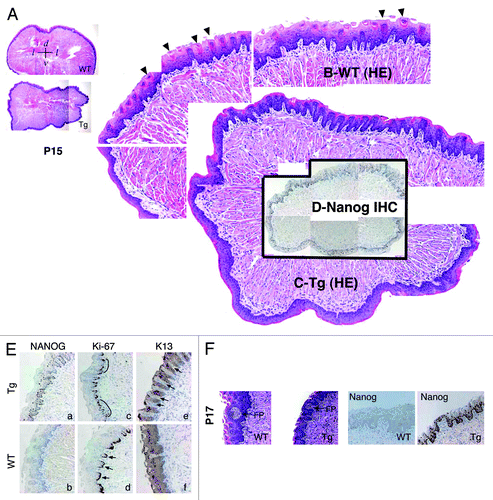
Figure 3. Abnormal differentiation in the K14-NanogP8 Tg tongue epithelia. (A–D) Gross images of the P15 WT and L1 Tg tongue. A. Representative composite images of a P15 WT (top) and a P15 L1 Tg (bottom) tongue sections stained for H and E. The orientations of the sections were indicated: d, dorsal; v, ventral; l, lateral. (B and C) Enlarged composites showing the presence of differentiated filiform papillae in the WT tongue (B; arrowheads), which were lacking in the Tg tongue (C). (D) NanogP8 staining in the Tg tongue (original magnification, ×40). The WT tongue did not show NanogP8 staining (not shown). (E) Representative IHC images of P15 WT and L1 Tg tongue epithelium stained for Nanog, Ki-67, and K13. Arrows indicate increased numbers of K13-negative dermal papillae in the Tg tongue. Note that in WT epithelium the Ki-67 cells localized mainly to the base of retelike prominences (D, arrows) but in Tg epithelium the Ki-67 cells were often contiguous (C, black lines). (F) Representative H and E and Nanog IHC images from a pair of P17 WT and L1 Tg tongue epithelium. FP, fungiform papillae. Original magnifications, ×200.

Figure 4. NanogP8 expression unexpectedly inhibits tumor development. (A) Two-stage skin carcinogenesis timeline. (B and C) Graphs depicting tumor incidence (B) and multiplicity (C). *P < 0.0001 for both (B and C) (χ2 test). (D) Representative images of mice bearing papillomas or carcinomas. (E) Tumors developed in the L1 Tg animals were significantly smaller. All tumors in each group were harvested at study’s conclusion (i.e., the end of 26 wk) and weighed. The line 1 papillomas were roughly one-third the mass of those induced in WT or L3 mice (P < 0.01). Shown below were representative images of WT (top) and L1 tumors. (F) Table depicting total tumor burden by line. WT papillomas converted to squamous cell carcinomas at ~2%, similar to the conversion rate seen in L3 animals. Papillomas in L1 mice did not progress to carcinomas. (G) Histological characterizations of tumors in WT and L1 animals. Shown are representative images of papilloma (a) and carcinoma (e) in WT or well-differentiated papilloma only (f) in L1 animals. Shown are also IHC staining of Ki-67, caspase-3, and NanogP8. Original magnifications: ×200 (for c, h, and j) or ×40 (the rest) (H) Histological and IHC characterizations of tumors arising in L3 animals (a-c, ×40; d–f, ×100).
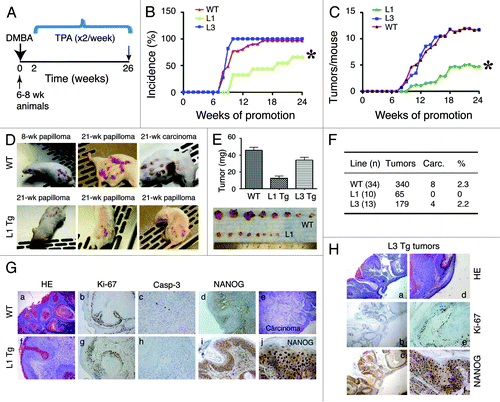
Figure 4. NanogP8 expression unexpectedly inhibits tumor development. (A) Two-stage skin carcinogenesis timeline. (B and C) Graphs depicting tumor incidence (B) and multiplicity (C). *P < 0.0001 for both (B and C) (χ2 test). (D) Representative images of mice bearing papillomas or carcinomas. (E) Tumors developed in the L1 Tg animals were significantly smaller. All tumors in each group were harvested at study’s conclusion (i.e., the end of 26 wk) and weighed. The line 1 papillomas were roughly one-third the mass of those induced in WT or L3 mice (P < 0.01). Shown below were representative images of WT (top) and L1 tumors. (F) Table depicting total tumor burden by line. WT papillomas converted to squamous cell carcinomas at ~2%, similar to the conversion rate seen in L3 animals. Papillomas in L1 mice did not progress to carcinomas. (G) Histological characterizations of tumors in WT and L1 animals. Shown are representative images of papilloma (a) and carcinoma (e) in WT or well-differentiated papilloma only (f) in L1 animals. Shown are also IHC staining of Ki-67, caspase-3, and NanogP8. Original magnifications: ×200 (for c, h, and j) or ×40 (the rest) (H) Histological and IHC characterizations of tumors arising in L3 animals (a-c, ×40; d–f, ×100).

Figure 5. Wound-healing defects in adult L1 Tg animals and migratory deficiency in L1 keratinocytes (A) Representative ear images of a WT mouse and a L1 Tg mouse (both ~6-mo-old). (B) Wound-healing defects in 3-mo-old L1 Tg. Shown on top are representative H and E images (×40) depicting that the WT epidermis completely re-epithelialized and closed the wound 1 wk after injury, whereas the L1 Tg epidermis showed disorganized and incompletely healed wound. Shown at the bottom are gross images of wounds in WT and Tg animals 12 d post epidermal abrasion. Note incomplete wound closure in the L1 Tg epidermis. The H and E and gross images shown are representative of a total 11 (for WT) and 9 (for L1 Tg) animals analyzed. (C) IHC staining for Ki-67 and K6 as short-term markers of proliferation and differentiation, respectively. Shown are images 48 h after wounding. Original magnifications, ×100. (D) Graph depicting the number of cells that migrated into scrape wound area 12 h post-scrap (left) and microscopic images of newborn keratinocyte cultures at 0 and 12 h post-scrape (right).
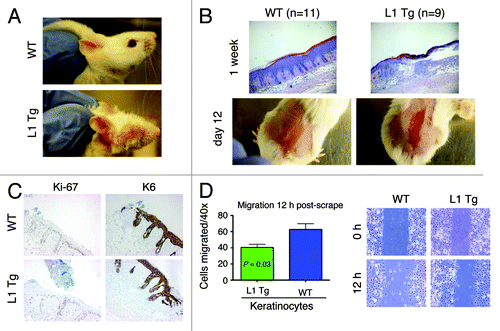
Figure 5. Wound-healing defects in adult L1 Tg animals and migratory deficiency in L1 keratinocytes (A) Representative ear images of a WT mouse and a L1 Tg mouse (both ~6-mo-old). (B) Wound-healing defects in 3-mo-old L1 Tg. Shown on top are representative H and E images (×40) depicting that the WT epidermis completely re-epithelialized and closed the wound 1 wk after injury, whereas the L1 Tg epidermis showed disorganized and incompletely healed wound. Shown at the bottom are gross images of wounds in WT and Tg animals 12 d post epidermal abrasion. Note incomplete wound closure in the L1 Tg epidermis. The H and E and gross images shown are representative of a total 11 (for WT) and 9 (for L1 Tg) animals analyzed. (C) IHC staining for Ki-67 and K6 as short-term markers of proliferation and differentiation, respectively. Shown are images 48 h after wounding. Original magnifications, ×100. (D) Graph depicting the number of cells that migrated into scrape wound area 12 h post-scrap (left) and microscopic images of newborn keratinocyte cultures at 0 and 12 h post-scrape (right).

Figure 6. Stem cell defects in L1 Tg keratinocytes. (A) Schematic showing mouse IFE, hair follicle, and the resident stem cell populations. (B and C) Reduced numbers of CD34+α6+ bulge stem cells in the L1 Tg hair follicles. Hair follicles were prepared from 8-wk-old mouse dorsal skin and CD34+α6+ bulge stem cells analyzed by flow cytometry. (B) Bar graph presentation of CD34+α6+ cells. (C) Representative flow cytometry plots of CD34 and a6 staining. (D and E) Reduced numbers of Lrig1+ stem cells in the L1 Tg hair follicles. Hair follicles were prepared from 6–8-wk-old mouse dorsal skin and Lrig1+α6+ bulge stem cells analyzed by flow cytometry. (D) Bar graph presentation of Lrig1+ stem cells. (D) Representative flow cytometry plots of Lrig1 and α6 staining. (F) qPCR analysis of 16 genes in keratinocytes prepared from 6–8 wk WT or L1 Tg animals.
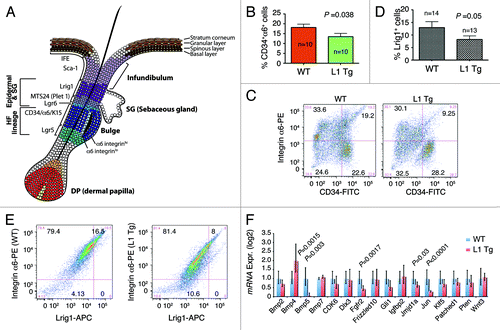
Figure 6. Stem cell defects in L1 Tg keratinocytes. (A) Schematic showing mouse IFE, hair follicle, and the resident stem cell populations. (B and C) Reduced numbers of CD34+α6+ bulge stem cells in the L1 Tg hair follicles. Hair follicles were prepared from 8-wk-old mouse dorsal skin and CD34+α6+ bulge stem cells analyzed by flow cytometry. (B) Bar graph presentation of CD34+α6+ cells. (C) Representative flow cytometry plots of CD34 and a6 staining. (D and E) Reduced numbers of Lrig1+ stem cells in the L1 Tg hair follicles. Hair follicles were prepared from 6–8-wk-old mouse dorsal skin and Lrig1+α6+ bulge stem cells analyzed by flow cytometry. (D) Bar graph presentation of Lrig1+ stem cells. (D) Representative flow cytometry plots of Lrig1 and α6 staining. (F) qPCR analysis of 16 genes in keratinocytes prepared from 6–8 wk WT or L1 Tg animals.

Figure 7. Ex vivo clonal assays in keratinocytes and c-Myc expression. (A) Exogenous murine Bmp5 rescues the clonogenic defects in 2–3-mo-old L1 Tg keratinocytes. Shown are the quantification of colonies arising from WT and L1 Tg keratinocytes with or without exogenous Bmp5 (top, bar graph) and representative images of keratinocyte colonies stained with Rhodamine B (bottom). P values for relevant comparisons are indicated. (B) Microphotographs showing representative WT and L1 Tg keratinocyte colonies. Original magnifications, ×100. (C) Scatter plot illustrating differences in colony sizes between WT and L1 keratinocytes. (D and E) Increased c-Myc positive cells in the P5 L1 Tg epidermis. Shown in (D) are representative images of c-Myc IHC in two WT and L1 Tg animals (original magnifications; 200×). Shown in (E) is the quantification of c-Myc positive nuclei per mm epidermal length measured using the Aperio ScanScope “nuclear” algorithm over 3 mm epidermis.
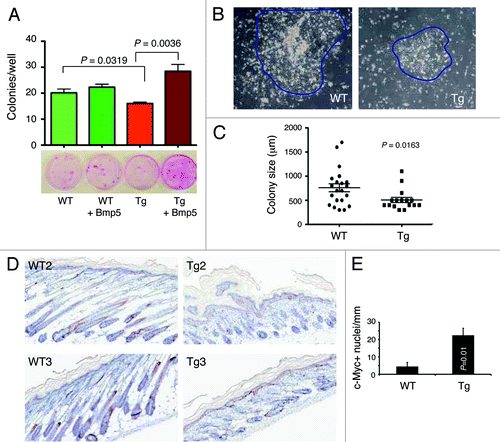
Figure 7. Ex vivo clonal assays in keratinocytes and c-Myc expression. (A) Exogenous murine Bmp5 rescues the clonogenic defects in 2–3-mo-old L1 Tg keratinocytes. Shown are the quantification of colonies arising from WT and L1 Tg keratinocytes with or without exogenous Bmp5 (top, bar graph) and representative images of keratinocyte colonies stained with Rhodamine B (bottom). P values for relevant comparisons are indicated. (B) Microphotographs showing representative WT and L1 Tg keratinocyte colonies. Original magnifications, ×100. (C) Scatter plot illustrating differences in colony sizes between WT and L1 keratinocytes. (D and E) Increased c-Myc positive cells in the P5 L1 Tg epidermis. Shown in (D) are representative images of c-Myc IHC in two WT and L1 Tg animals (original magnifications; 200×). Shown in (E) is the quantification of c-Myc positive nuclei per mm epidermal length measured using the Aperio ScanScope “nuclear” algorithm over 3 mm epidermis.
Supplemental material

Additional material

Download Zip (2 MB)