2,051
Views
55
CrossRef citations to date
0
Altmetric
Report

Cell cycle regulators cyclin D1 and CDK4/6 have estrogen receptor-dependent divergent functions in breast cancer migration and stem cell-like activity

, , , &
Pages 2384-2394 | Received 28 Mar 2013, Accepted 13 Jun 2013, Published online: 26 Jun 2013

Figures & data

Figure 1. Downregulation of cyclin D1 and CDK4/6 in breast cancer cell lines and primary human breast cancer cells and effects on migration and mammosphere formation. (A) Immunoblots showing cyclin D1 and CDK4/6 protein expression following siRNA treatment to target cyclin D1, CDK4/6, or non-silencing control. (B) Following siRNA treatment, cells were assessed for migration (upper panel) and mammosphere formation (lower panel) in ER−ve and ER+ve (n = 4) cell lines and primary human breast cancer cells (n = 6). Bar charts represent the mean % number of migrated cells and % mammosphere formation, ± SEM. Cyclin D1 siRNA or CDK4/6 siRNA were compared with control siRNA to generate P values using a two-sided t test assuming equal variance. * Indicates significance, P < 0.05.
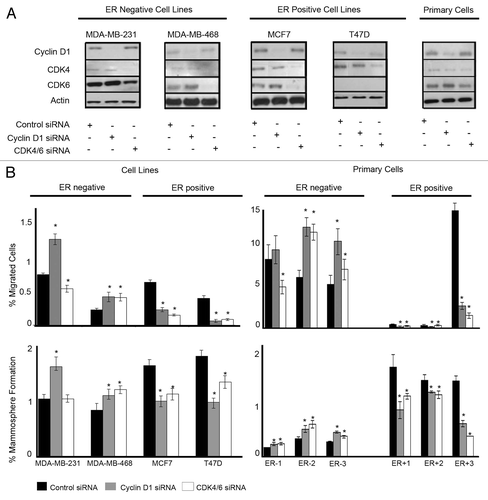
Figure 1. Downregulation of cyclin D1 and CDK4/6 in breast cancer cell lines and primary human breast cancer cells and effects on migration and mammosphere formation. (A) Immunoblots showing cyclin D1 and CDK4/6 protein expression following siRNA treatment to target cyclin D1, CDK4/6, or non-silencing control. (B) Following siRNA treatment, cells were assessed for migration (upper panel) and mammosphere formation (lower panel) in ER−ve and ER+ve (n = 4) cell lines and primary human breast cancer cells (n = 6). Bar charts represent the mean % number of migrated cells and % mammosphere formation, ± SEM. Cyclin D1 siRNA or CDK4/6 siRNA were compared with control siRNA to generate P values using a two-sided t test assuming equal variance. * Indicates significance, P < 0.05.

Figure 2. Cell cycle modulation affects ALDH activity. (A) ER−ve and ER+ve cell lines (n = 4) were treated with either control, cyclin D1 siRNA, or CDK4/6 siRNA, and ALDH activity was assessed. Data are presented as mean fold change compared with control siRNA with ± SEM (B) ER−ve and ER+ve cell lines (n = 4) were transfected with either control vector or cyclin D1 vector and ALDH activity assessed. P values were generated using a two-sided t test assuming equal variance. *Indicates significance, P < 0.05.
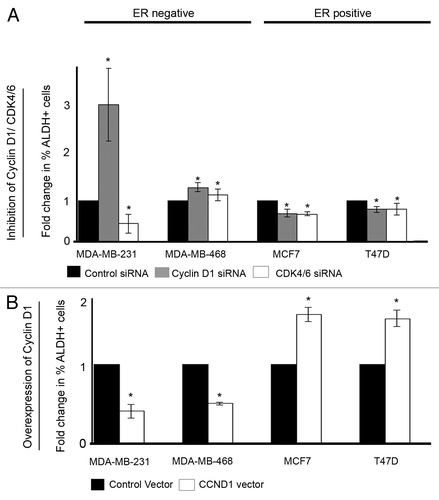
Figure 2. Cell cycle modulation affects ALDH activity. (A) ER−ve and ER+ve cell lines (n = 4) were treated with either control, cyclin D1 siRNA, or CDK4/6 siRNA, and ALDH activity was assessed. Data are presented as mean fold change compared with control siRNA with ± SEM (B) ER−ve and ER+ve cell lines (n = 4) were transfected with either control vector or cyclin D1 vector and ALDH activity assessed. P values were generated using a two-sided t test assuming equal variance. *Indicates significance, P < 0.05.

Figure 3. Overexpression of cyclin D1 in breast cancer cell lines and primary human breast cancer cells and effects on migration and mammosphere formation. (A) Immunoblots confirming cyclin D1 overexpression following vector transfections. (B) Following vector transfections, cells were assessed for migration (upper panel) and mammosphere formation (lower panel) in ER−ve and ER+ve cell lines (n = 4) and primary human breast cancer cells (n = 6). Bar charts represent the mean % number of migrated cells and % mammospheres formation, ± SEM. Cyclin D1 was compared with control vector to generate P values using a two-sided t test assuming equal variance. *Indicates significance, P < 0.05.
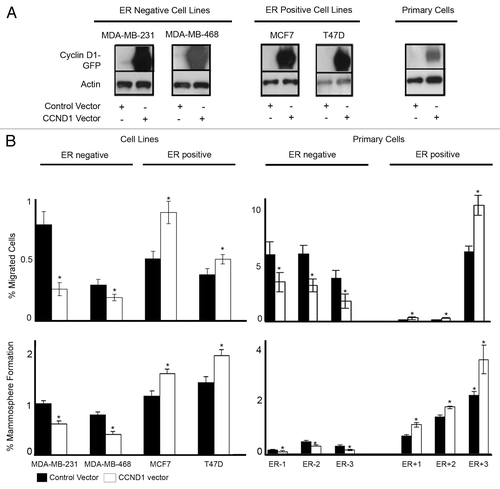
Figure 3. Overexpression of cyclin D1 in breast cancer cell lines and primary human breast cancer cells and effects on migration and mammosphere formation. (A) Immunoblots confirming cyclin D1 overexpression following vector transfections. (B) Following vector transfections, cells were assessed for migration (upper panel) and mammosphere formation (lower panel) in ER−ve and ER+ve cell lines (n = 4) and primary human breast cancer cells (n = 6). Bar charts represent the mean % number of migrated cells and % mammospheres formation, ± SEM. Cyclin D1 was compared with control vector to generate P values using a two-sided t test assuming equal variance. *Indicates significance, P < 0.05.
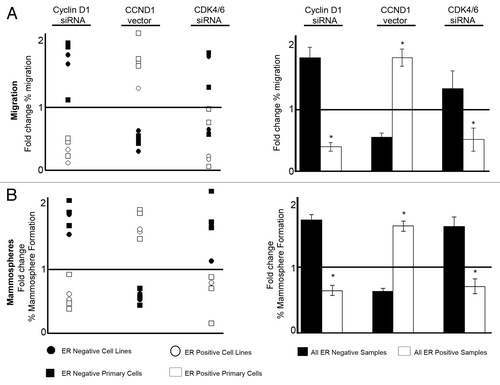
Figure 4. Summary of effects on cell migration and mammosphere formation resulting from cell cycle modulation in breast cancer lines and primary human breast cancer cells. (A) Summary of migration data plotted as mean fold change compared with corresponding control treatment. Left panel indicates data from both cell lines and primary samples, whereas the right panel summarizes the combined effects on migration according to ER status, with ± SEM (B) Summary of mammosphere data plotted as mean fold change compared with corresponding control treatment. Left panel indicates data from both cell lines and primary samples whereas the right panel summarizes the combined effects on mammosphere formation according to ER status, with ± SEM. Horizontal line at a value of y = 1 indicates no fold change. Controls were compared with each treatment to generate P values using a two-sided t test assuming equal variance. *Indicates significance, P < 0.05.

Figure 4. Summary of effects on cell migration and mammosphere formation resulting from cell cycle modulation in breast cancer lines and primary human breast cancer cells. (A) Summary of migration data plotted as mean fold change compared with corresponding control treatment. Left panel indicates data from both cell lines and primary samples, whereas the right panel summarizes the combined effects on migration according to ER status, with ± SEM (B) Summary of mammosphere data plotted as mean fold change compared with corresponding control treatment. Left panel indicates data from both cell lines and primary samples whereas the right panel summarizes the combined effects on mammosphere formation according to ER status, with ± SEM. Horizontal line at a value of y = 1 indicates no fold change. Controls were compared with each treatment to generate P values using a two-sided t test assuming equal variance. *Indicates significance, P < 0.05.

Figure 5. Clinical inhibitors of Cyclin D1 and CDK4/6 in breast cancer cell lines and primary human breast cancer cells effects mammosphere formation. Cells were plated into mammosphere culture with the addition of either (A) Flavopiridol or (B) PD0332991 at various concentrations. Bars represent the mean % mammosphere formation for three experiments with ± SEM. Comparisons to 0 ng/ml were made to generate P values using a two-sided t-test assuming equal variance. *Indicates significance, P value < 0.05.
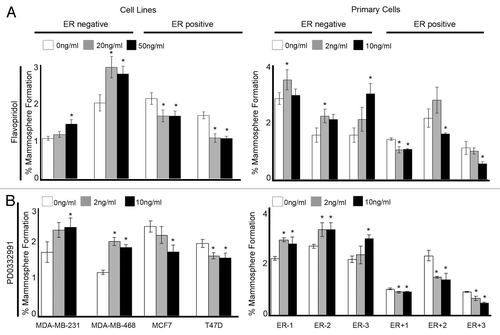
Figure 5. Clinical inhibitors of Cyclin D1 and CDK4/6 in breast cancer cell lines and primary human breast cancer cells effects mammosphere formation. Cells were plated into mammosphere culture with the addition of either (A) Flavopiridol or (B) PD0332991 at various concentrations. Bars represent the mean % mammosphere formation for three experiments with ± SEM. Comparisons to 0 ng/ml were made to generate P values using a two-sided t-test assuming equal variance. *Indicates significance, P value < 0.05.

Figure 6. Re-expression of ER in ER−ve cell lines reverses the response to cell cycle modulation. MDA-MB-231 breast cancer cells were treated with the indicated siRNA or vector followed by assessment of migration and mammosphere formation. (A) Immunoblot confirmed the silencing of cyclin D1 and overexpression or ER. Bar charts represent the mean % migration and mammosphere formation with ± SEM (B) Immunoblot confirmed the overexpression of GFP-CCND1 and ER. Bar charts represent the mean % migration and mammosphere formation with ± SEM (C) MDA-MB-231 and MDA-MB-468 breast cancer cell lines were transfected with either control or ER vector and plated into mammosphere culture +/− treatment with either Flavopiridol or PD0332991 of various concentrations. P values were generated using a two-sided t test assuming equal variance. *Indicates significance, P < 0.05.
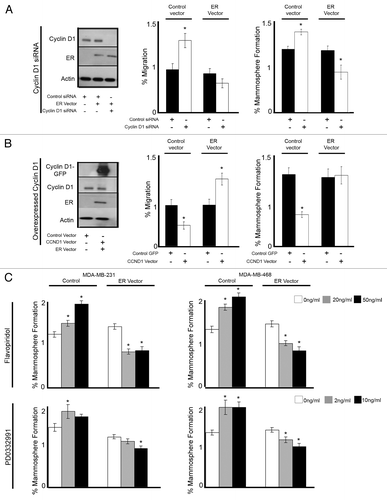
Figure 6. Re-expression of ER in ER−ve cell lines reverses the response to cell cycle modulation. MDA-MB-231 breast cancer cells were treated with the indicated siRNA or vector followed by assessment of migration and mammosphere formation. (A) Immunoblot confirmed the silencing of cyclin D1 and overexpression or ER. Bar charts represent the mean % migration and mammosphere formation with ± SEM (B) Immunoblot confirmed the overexpression of GFP-CCND1 and ER. Bar charts represent the mean % migration and mammosphere formation with ± SEM (C) MDA-MB-231 and MDA-MB-468 breast cancer cell lines were transfected with either control or ER vector and plated into mammosphere culture +/− treatment with either Flavopiridol or PD0332991 of various concentrations. P values were generated using a two-sided t test assuming equal variance. *Indicates significance, P < 0.05.

Reprints and Corporate Permissions

Please note: Selecting permissions does not provide access to the full text of the article, please see our help page How do I view content?

To request a reprint or corporate permissions for this article, please click on the relevant link below:

Academic Permissions

Please note: Selecting permissions does not provide access to the full text of the article, please see our help page How do I view content?

Obtain permissions instantly via Rightslink by clicking on the button below:

If you are unable to obtain permissions via Rightslink, please complete and submit this Permissions form. For more information, please visit our Permissions help page.