607
Views
7
CrossRef citations to date
0
Altmetric
Report

Somatic inactivation of Tp53 in hematopoietic stem cells or thymocytes predisposes mice to thymic lymphomas with clonal translocations

, &
Pages 3307-3316 | Received 07 Aug 2013, Accepted 28 Aug 2013, Published online: 09 Sep 2013

Figures & data

Figure 1. Mice with conditional inactivation of Tp53 initiating in HSCs or DN thymocytes reproducibly succumb to thymic lymphomas. (A) Kaplan–Meier curves comparing tumor-free survival of 22 VP and 20LP mice. All tumors were thymic lymphomas other than 2 VP mice that succumbed to B lineage lymphomas (indicated by asterisks). Additionally, one LP mouse succumbed to a sarcoma, and one mouse of each cohort did not succumb to any tumors by 1 year of age. Curves were compared using the log-rank (Mantel–Cox) test, P = 0.134 (B) Flow cytometry analyses of VP lymphomas no 118 and 975 and of LP lymphomas no. 740 and 976 showing their surface expression of CD3 and TCRβ or CD4 and CD8. Gates were drawn on normal T cells analyzed in parallel with the lymphomas. The percentages of cells in each gate are indicated. (C) Flow cytometry analyses of VP lymphomas no. 421 and 426 showing their surface expression of B220 and IgM or Igκ and Igλ. Gates were drawn on normal B cells analyzed in parallel with lymphomas. The percentages of tumor cells in each gate are indicated.
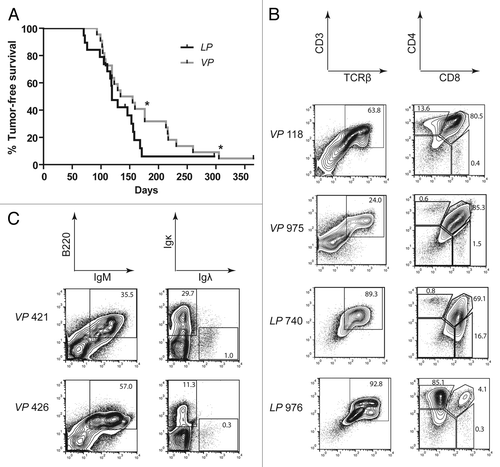
Figure 1. Mice with conditional inactivation of Tp53 initiating in HSCs or DN thymocytes reproducibly succumb to thymic lymphomas. (A) Kaplan–Meier curves comparing tumor-free survival of 22 VP and 20LP mice. All tumors were thymic lymphomas other than 2 VP mice that succumbed to B lineage lymphomas (indicated by asterisks). Additionally, one LP mouse succumbed to a sarcoma, and one mouse of each cohort did not succumb to any tumors by 1 year of age. Curves were compared using the log-rank (Mantel–Cox) test, P = 0.134 (B) Flow cytometry analyses of VP lymphomas no 118 and 975 and of LP lymphomas no. 740 and 976 showing their surface expression of CD3 and TCRβ or CD4 and CD8. Gates were drawn on normal T cells analyzed in parallel with the lymphomas. The percentages of cells in each gate are indicated. (C) Flow cytometry analyses of VP lymphomas no. 421 and 426 showing their surface expression of B220 and IgM or Igκ and Igλ. Gates were drawn on normal B cells analyzed in parallel with lymphomas. The percentages of tumor cells in each gate are indicated.

Table 1. Summary of VP tumor cohort

Table 2. Summary of LP tumor cohort

Figure 2. Mice with conditional inactivation of Tp53 initiating in HSCs or DN thymocytes develop clonal thymic lymphomas. (A) Schematic of the mouse TCRβ locus showing relative locations of representative upstream Vβs, the 2 Dβ-Jβ-Cβ clusters, and the Vβ14 segment. The positions of the HindIII restriction sites (H3) and 3′Jβ1 and 3′Jβ2 probes used for Southern analyses are also shown. (B and C). Southern blot analysis of HindIII-digested DNA isolated from the indicated (B) VP or (C) LP lymphomas or from kidneys of C57BL/6 (B6) or 129/SvEv (129) control mice using the 3′Jβ1 or 3′Jβ2 probe. Germline (GL) bands for each probe are indicated. Membranes were hybridized with 3′Jβ1 probes, stripped, and then hybridized with 3′Jβ2 probes to reveal which lymphomas contained Vβ rearrangements to the Dβ2-Jβ2 cluster on both alleles.
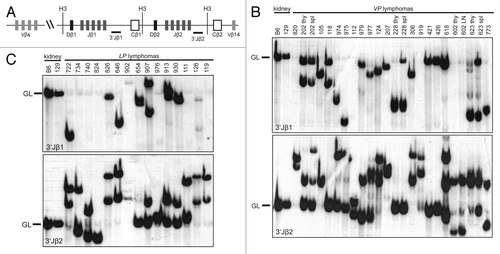
Figure 2. Mice with conditional inactivation of Tp53 initiating in HSCs or DN thymocytes develop clonal thymic lymphomas. (A) Schematic of the mouse TCRβ locus showing relative locations of representative upstream Vβs, the 2 Dβ-Jβ-Cβ clusters, and the Vβ14 segment. The positions of the HindIII restriction sites (H3) and 3′Jβ1 and 3′Jβ2 probes used for Southern analyses are also shown. (B and C). Southern blot analysis of HindIII-digested DNA isolated from the indicated (B) VP or (C) LP lymphomas or from kidneys of C57BL/6 (B6) or 129/SvEv (129) control mice using the 3′Jβ1 or 3′Jβ2 probe. Germline (GL) bands for each probe are indicated. Membranes were hybridized with 3′Jβ1 probes, stripped, and then hybridized with 3′Jβ2 probes to reveal which lymphomas contained Vβ rearrangements to the Dβ2-Jβ2 cluster on both alleles.

Figure 3. Mice with conditional inactivation of Tp53 initiating in HSCs also develop clonal B lineage lymphomas. (A) Schematic of the mouse IgH locus showing relative locations of representative DH segments, the 4 JH segments, the Sμ region, and the first CH exon, Cμ. The positions of the EcoRI restriction sites (RI) and 3′JH and 3′Sμ probes used for Southern blots are also shown. (B and C) Southern blot analysis of EcoRI-digested DNA isolated from VP lymphomas no. 421 or 426 or from kidneys of C57BL/6 (B6) or 129/SvEv (129) control mice using the (B) 3′JH and (C) 3′Sμ probes. Germline (GL) bands for each probe are indicated. (D) Schematic of the mouse Igκ locus showing relative locations of the 5 Jκ segments and the Cκ exon. The positions of the BamHI restriction sites (BHI) and 3′Jκ probe used for Southern blots are also shown. (E) Southern blot analysis of BamHI-digested DNA isolated from VP lymphomas no. 421 or 426 or from kidneys of C57BL/6 (B6) or 129/SvEv (129) control mice using the 3′Jκ probe. Germline (GL) band for the 3′Jκ probe is indicated. (F) Schematic of the mouse c-Myc locus showing relative locations of the three c-Myc exons, and of the EcoRI restriction sites (RI) and 3′Myc probe used for Southern blots. (G) Southern blot analysis of EcoRI-digested DNA isolated from VP lymphomas no. 421 or 426 or from kidneys of C57BL/6 (B6) or 129/SvEv (129) control mice using the 3′Myc probe. Germline (GL) band for the 3′Myc probe is indicated.
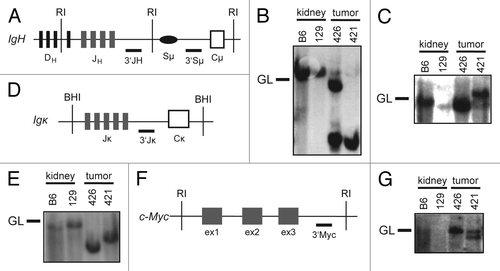
Figure 3. Mice with conditional inactivation of Tp53 initiating in HSCs also develop clonal B lineage lymphomas. (A) Schematic of the mouse IgH locus showing relative locations of representative DH segments, the 4 JH segments, the Sμ region, and the first CH exon, Cμ. The positions of the EcoRI restriction sites (RI) and 3′JH and 3′Sμ probes used for Southern blots are also shown. (B and C) Southern blot analysis of EcoRI-digested DNA isolated from VP lymphomas no. 421 or 426 or from kidneys of C57BL/6 (B6) or 129/SvEv (129) control mice using the (B) 3′JH and (C) 3′Sμ probes. Germline (GL) bands for each probe are indicated. (D) Schematic of the mouse Igκ locus showing relative locations of the 5 Jκ segments and the Cκ exon. The positions of the BamHI restriction sites (BHI) and 3′Jκ probe used for Southern blots are also shown. (E) Southern blot analysis of BamHI-digested DNA isolated from VP lymphomas no. 421 or 426 or from kidneys of C57BL/6 (B6) or 129/SvEv (129) control mice using the 3′Jκ probe. Germline (GL) band for the 3′Jκ probe is indicated. (F) Schematic of the mouse c-Myc locus showing relative locations of the three c-Myc exons, and of the EcoRI restriction sites (RI) and 3′Myc probe used for Southern blots. (G) Southern blot analysis of EcoRI-digested DNA isolated from VP lymphomas no. 421 or 426 or from kidneys of C57BL/6 (B6) or 129/SvEv (129) control mice using the 3′Myc probe. Germline (GL) band for the 3′Myc probe is indicated.

Figure 4. Mice with conditional inactivation of Tp53 initiating in HSCs or DN thymocytes develop lymphomas with oncogenic antigen receptor locus translocations. (A) Cytogenetic analysis of a metaphase from VP lymphoma no. 820 with the clonal t(2;17) translocation circled or isolated. (A, i) Spectral image. (A, ii) DAPI image. (A, iii) Karyotype table. (B) Cytogenetic analyses of a metaphase or chromosome from VP lymphoma no. 421 with the clonal t(12;15) translocation circled. (B, i) SKY image. (B, ii) DAPI image. (B, iii) Karyotype table. (B, iv). SKY (left) or FISH image (right) of the t(12;15) translocation hybridized with 3′IgH (green) and c-Myc (red) probes. (C) Cytogenetic analyses of a metaphase or chromosome from LP lymphoma no. 902 with the clonal t(4;15;14) translocation circled or isolated. (B, i) SKY image. (B, ii) DAPI image. (B, iii) Karyotype table. (B, iv) SKY (top) or FISH images of the t(4;15;14) translocation. (middle) hybridized with TCRVδ3/Vα6 (green) and TCRCα (red) probes. (bottom) hybridized with c-Myc (green) probe.
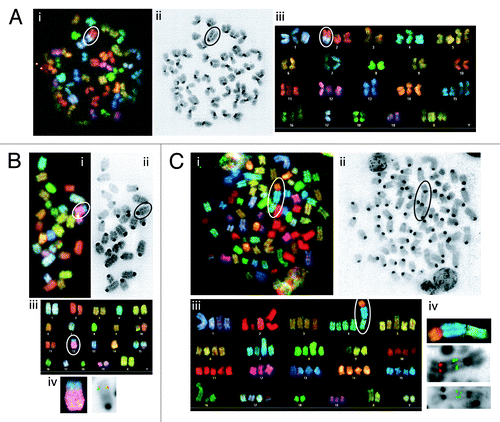
Figure 4. Mice with conditional inactivation of Tp53 initiating in HSCs or DN thymocytes develop lymphomas with oncogenic antigen receptor locus translocations. (A) Cytogenetic analysis of a metaphase from VP lymphoma no. 820 with the clonal t(2;17) translocation circled or isolated. (A, i) Spectral image. (A, ii) DAPI image. (A, iii) Karyotype table. (B) Cytogenetic analyses of a metaphase or chromosome from VP lymphoma no. 421 with the clonal t(12;15) translocation circled. (B, i) SKY image. (B, ii) DAPI image. (B, iii) Karyotype table. (B, iv). SKY (left) or FISH image (right) of the t(12;15) translocation hybridized with 3′IgH (green) and c-Myc (red) probes. (C) Cytogenetic analyses of a metaphase or chromosome from LP lymphoma no. 902 with the clonal t(4;15;14) translocation circled or isolated. (B, i) SKY image. (B, ii) DAPI image. (B, iii) Karyotype table. (B, iv) SKY (top) or FISH images of the t(4;15;14) translocation. (middle) hybridized with TCRVδ3/Vα6 (green) and TCRCα (red) probes. (bottom) hybridized with c-Myc (green) probe.
Supplemental material

Additional material

Download Zip (2.3 MB)

Reprints and Corporate Permissions

Please note: Selecting permissions does not provide access to the full text of the article, please see our help page How do I view content?

To request a reprint or corporate permissions for this article, please click on the relevant link below:

Academic Permissions

Please note: Selecting permissions does not provide access to the full text of the article, please see our help page How do I view content?

Obtain permissions instantly via Rightslink by clicking on the button below:

If you are unable to obtain permissions via Rightslink, please complete and submit this Permissions form. For more information, please visit our Permissions help page.