Figures & data
Figure 1. Differences in the levels of DNA repair factors between growth-arrested and cycling human fibroblasts. (A) Cell cycle profile of human fibroblasts expressing telomerase (BJ+hTERT) either growing asynchronously, growth arrested by contact inhibition, or released from the growth arrest. Cells were fixed and labeled with propidium iodide and analyzed for fluorescent DNA content using the Nexcelom Cellometer. The percentage of cells in G0/G1, S, and G2/M phases of the cell cycle is shown under each cell cycle profile. (B) Western blots to monitor the levels of the protease cathepsin L (CTSL), DNA repair factors (53BP1, BRCA1, RPA), cell cycle regulators (Cyclin A, p107), and loading control Lamin A/C in growth-arrested and cycling fibroblasts treated with cathepsin inhibitor E64 or vehicle control. Note the marked increase in CTSL and the decrease in 53BP1 and BRCA1 levels in growth-arrested cells and how E64 treatment prevents 53BP1 decrease. (C) Cell cycle profile monitored as in (A) but in cells incubated with 10 μM E64 throughout the time course of the experiment. (D) Western blots in cells treated with E64 to monitor the same proteins as in (B). Note how inhibition of cathepsin activity with E64 prevents the decrease in 53BP1 protein levels. Representative experiments of at least 3 biological repeats are shown.
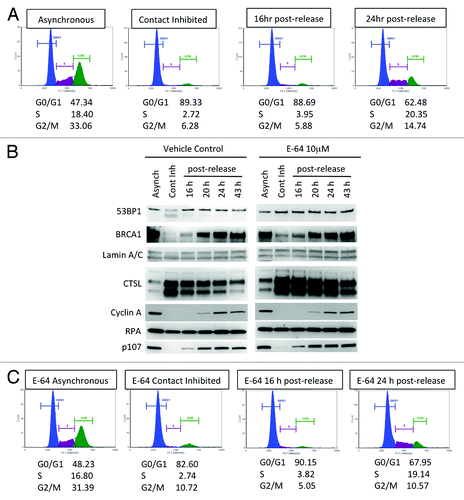
Figure 2. Transcripts levels of BRCA1, CTSL, and 53BP1 in growth-arrested and cycling human fibroblasts. (A) Quantitation of BRCA1 transcripts levels by qRT-PCR in human fibroblasts expressing telomerase (BJ+hTERT) either growing asynchronously, growth arrested by contact inhibition, or released from the growth arrest. Relative expression is compared in all conditions between cells incubated in water as control and cells incubated with 10 μM E64. (B) Quantitation of CTSL transcripts levels as in (A). (C) Quantitation of 53BP1 transcripts levels as in (A). **Represents P value of statistical significance (P ≤ 0.05) of that sample compared with all the other samples in the experiment. The complete statistical analysis of all the samples under the different conditions is shown in supplemental information.
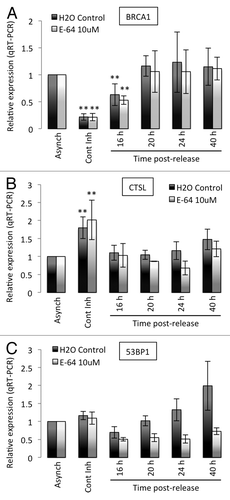
Figure 3. Levels of BRCA1 and 53BP1 and formation of IRIF in growth-arrested and cycling cells. (A) Immunofluorescence with BRCA1 antibody was performed in asynchronous and contact-inhibited cells that were irradiated with 8 Gy or mock irradiated. DAPI staining was used to identify all nuclei. Graph shows quantitation of the intensity of fluorescence (relative fluorescence units) in 200 cells per condition. (B) IF with BRCA1 antibody in cells of the same growth conditions as (A) after irradiation with 8 Gy.Note the decrease in BRCA1 intensity of fluorescence, both in control and irradiated growth-arrested cells. (C) The same experiments as in (A) were performed with 53BP1 antibody. (D) The same experiments as in (B) were performed with 53BP1 antibody.Note how 53BP1 levels mirror BRCA1 in all conditions tested, with low levels of 53BP1 in growth-arrested cells irradiated and control. *Represents P value of statistical significance (P ≤ 0.05).
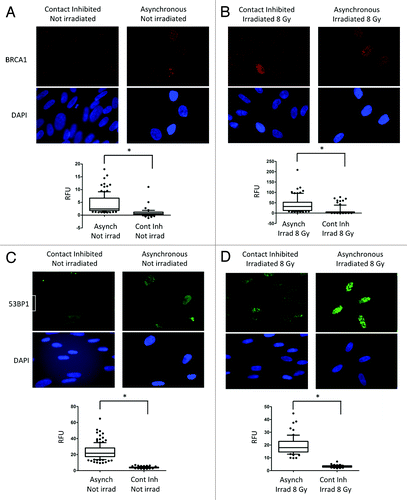
Figure 4. Levels of 53BP1 and formation of IRIF in cycling cells. Immunofluorescence with 53BP1 and Cyclin A antibodies was performed in asynchronously growing cells that were irradiated with 8 Gy or mock irradiated. DAPI staining was used to identify all nuclei. Cyclin A positive cells represent cells in S/G2 phases of the cell cycle, while Cyclin A-negative cells represent cells in G1. Graphs show quantitation of the intensity of fluorescence (relative fluorescence units) in 200 cells per condition. We compared intensity of fluorescence of 53BP1 between Cyclin A-positive (S/G2) and Cyclin A-negative (G1) cells that were irradiated with 8 Gy. Statistically significant differences were not observed (NS).
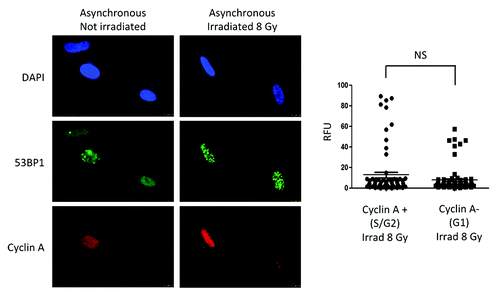
Figure 5. Differences in the levels of DNA repair factors between growth-arrested and cycling breast cancer cells. (A) Cell cycle profile of breast cancer cells (MCF7) either growing asynchronously, growth arrested by serum deprivation (starved), or released from the growth arrest by serum supplementation. Cells were fixed and labeled with propidium iodide and analyzed for fluorescent DNA content using the Nexcelom Cellometer. The percentage of cells in G0/G1, S, and G2/M phases of the cell cycle is shown under each cell cycle profile. (B) Western blots to monitor the levels of the protease cathepsin L (CTSL), DNA repair factors (53BP1, BRCA1, and RPA), and cell cycle regulators (Cyclin A, p107) in MCF7 cells proficient or deficient in CTSL (shscr and shCTSL, respectively). Note the increase in CTSL and the marked decrease in 53BP1 and BRCA1 levels in growth-arrested cells. (C) Cell cycle profile monitored as in (A), but in MCF7 cells depleted of CTSL via lentiviral transduction with a specific shRNA (shCTSL). The blots shown in (B) represent the same experiment and thus levels of all proteins can be compared. Note how depletion of cathepsin L prevents the decrease in 53BP1 protein levels. Representative experiments of at least 3 biological repeats are shown.
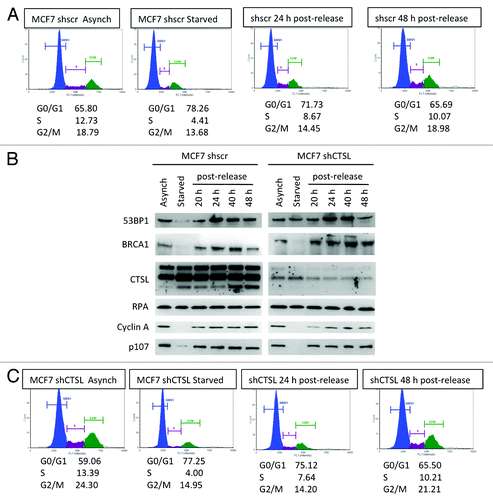
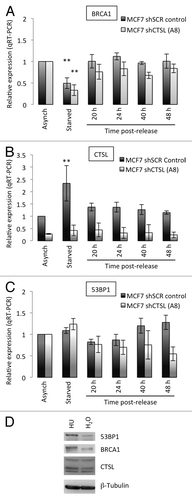
Figure 6. Transcripts levels of BRCA1, CTSL, and 53BP1 in growth-arrested and cycling breast cancer cells. (A) Quantitation of BRCA1 transcripts levels by qRT-PCR in breast cancer cells (MCF7) either growing asynchronously, growth arrested by serum deprivation (starved), or released from the growth arrest by serum supplementation. Relative expression is compared in all conditions between CTSL-proficient (shSCR) and CTSL-deficient (shCTSL) cells. (B) Quantitation of CTSL transcripts levels as in (A). (C) Quantitation of 53BP1 transcripts levels as in (A). **Represents P value of statistical significance (P ≤ 0.05) of that sample compared with all the other samples in the experiment. The complete statistical analysis of all the samples under the different conditions is shown in supplemental information. (D) MCF7 cells growing asynchronously were incubated in the presence of hydroxyurea (HU 1mM) or vehicle control (H2O) overnight and processed for western blot to monitor the levels of CTSL, 53BP1, and BRCA1. Note how HU treatment slightly increases the levels of 53BP1 and BRCA1.