Figures & data
Figure 1. SOCS-1 mRNA expression and its correlation with miR-29b levels in primary MM and PCL samples.(A). Differential expression of SOCS-1 mRNA in immunoselected CD138+ cells from 4 healthy donors (N), 55 MM classified according to the presence of the recurrent IGH chromosomal translocations and cyclin D expression (TC1: n = 12; TC2: n = 13; TC3: n = 12; TC4: n = 12; TC5: n = 6), 21 primary PCL (pPCL), and 8 secondary PCL (sPCL), as obtained by cDNA microarray; raw expression values are reported. Difference between normal and TC classes was assessed by t test using Welch correction or Wilcoxon rank sum test. SOCS-1 was significantly downregulated in all patient groups, except TC5, as compared with N samples (N vs TC1: P = 0.031; N vs TC2: P = 0.023; N vs TC3: P = 0.004; N vs TC4: P = 0.023; N vs TC5: P = 0.11; N vs pPCL: P = 0.03; N vs sPCL: P = 0.008).(B) Correlation analysis between endogenous miR-29b levels and SOCS-1 mRNA levels, determined by high density microarray of mRNA and miRNA expression in a panel of 34 MM (TC1:n = 6; TC2:n = 10; TC3:n = 9; TC4:n = 6; TC5:n = 3) and 18 pPCL samples (P = 0,09). Log values of raw data are reported in graph. Pearson test was used to evaluate the occurrence of correlation.
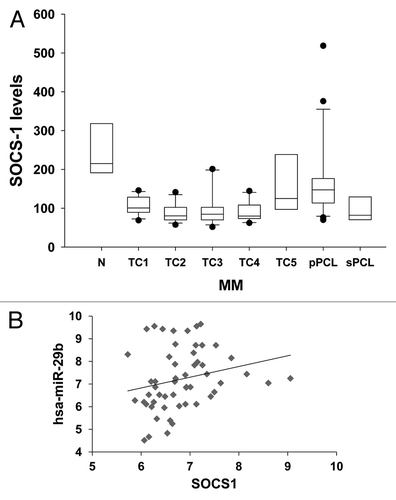
Figure 2. miR-29b demethylates SOCS-1 gene promoter.(A) Quantitative RT-PCR of miR-29b levels in NCI-H929 cells transfected with synthetic miR-29b mimics or scrambled oligonucleotides (NC). Raw Ct values were normalized to RNU44 housekeeping snoRNA and expressed as ΔΔCt values. miR-29b levels in cells transfected with NC were set as internal reference. Data are the average of 2 independent transfection experiments performed in triplicate.(B) Sequenom MassARRAY platform was used for the quantitative methylation analysis. Mean methylation levels of CpG sites in SOCS-1 promoter are reported. Data are expressed as mean ± SD of 2 independent experiments performed in triplicate. CpGs whose methylation was detectable at basal level in NCI-H929 transfected cells, have been analyzed. °P ≤ 0.05; *P ≤ 0.01.(C) Graphic representation of all CpGs within amplicon 9 and 10 of SOCS-1 promoter. Red circles indicate all CpGs found demethylated after miR-29b transfection; blue circles represent CpGs unmethylated at basal level or unaffected by miR-29b.(D) Immunoblot of SOCS-1, 24 h after transfection of NCI-H929 cells with synthetic miR-29b or scrambled oligonucleotides (NC). GAPDH was used as loading control.
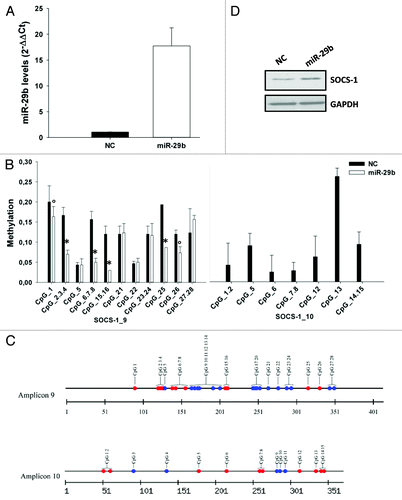
Figure 3. Bortezomib reduces global DNA methylation as well as SOCS-1 promoter methylation in MM cells.(A) Global DNA methylation levels were determined, as reported in the “Materials and Methods”, in NCI-H929 cells treated for 24 h with vehicle or bortezomib 0.5, 1.0 and 2.0 nM or(B) in NCI-H929 stably transduced with a control vector or miR-29b inhibitory sequences (anti-miR-29b) and then treated for 24 h with 1 nM bortezomib (BORT).(C) Mean methylation levels of CpG sites in SOCS-1 promoter, as determined by Sequenom MassARRAY analysis, in NCI-H929 cells treated for 24 h with vehicle or bortezomib 0.5, 1.0, or 2.0 nM. Data are expressed as mean ± SD of 2 independent experiments performed in triplicate.(D) Immunoblot of SOCS-1, 24 h after treatment of NCI-H929 cells with vehicle or bortezomib 0.5, 1.0 or 2.0 nM . GAPDH was used as loading control. *P ≤ 0.05; °P ≤ 0.01.(E) Quantitative RT-PCR of miR-29b levels in PCL patient-derived peripheral blood mononuclear cells, 24 and 72 h after systemic bortezomib treatment (1.3 mg/m2). Raw Ct values were normalized to RNU44 housekeeping snoRNA and expressed as ΔΔCt values. *P ≤ 0.01.
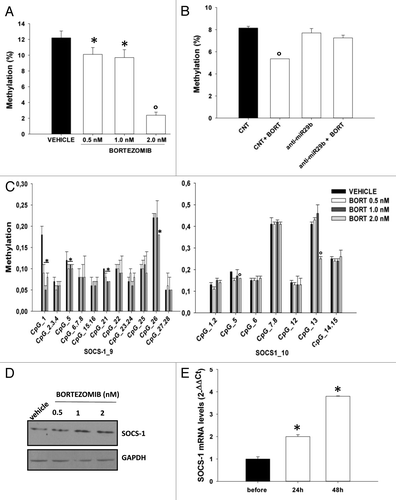
Figure 4. miR-29b inhibits STAT3 and NF-κB signaling in MM cells.(A) Immunoblot of STAT3 phosphorylated at Y705 or unphosphorylated, 24 h after transfection of U266 cells with synthetic miR-29b or scrambled oligonucleotides (NC).(B) Quantitative RT-PCR of VEGF-A 24 h after transfection of U266 cells with synthetic miR-29b or scrambled oligonucleotides (NC). The results are shown as average mRNA expression, in 3 independent experiments, after normalization with GAPDH and ΔΔCt calculations *P < 0.05;(C) Dual luciferase assay was performed in U266 cells transfected with miR-29b or scrambled oligonucleotides (NC), together with a firefly luciferase constructs containing the NFκB-responsive elements and the pRL-TK vector for normalization. The firefly luciferase activity was normalized to renilla luciferase activity. The data are shown as relative luciferase activity of miR-29b-transfected cells as compared with the control (NC), in a total of six experiments from 3 independent transfections. *P < 0.05(D) Immunoblot of IκB-α phosphorylated at Ser32 or unphosphorylated, 24 h after transfection of U266 cells with synthetic miR-29b or scrambled oligonucleotides (NC). GAPDH was used as loading control.(E) Quantitative RT-PCR of IL-8, 24 h after transfection of U266 cells with synthetic miR-29b or scrambled oligonucleotides (NC). The results are shown as average mRNA expression, in 3 independent experiments, after normalization with GAPDH and ΔΔCt calculations. *P < 0.05.
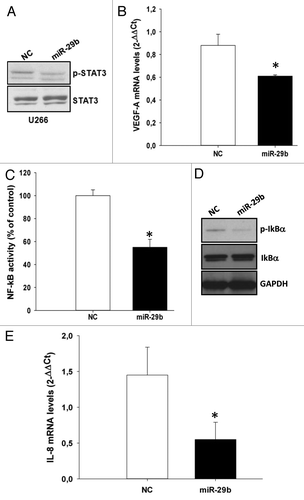
Figure 5. miR-29b inhibits MM cell migration.(A) Quantitative RT-PCR of miR-29b levels in OPM2 cells, 24 h after transfection with synthetic miR-29b mimics or scrambled oligonucleotides (NC). Raw Ct values were normalized to RNU44 housekeeping snoRNA and expressed as ΔΔCt values. miR-29b levels in cells transfected with NC were set as internal reference. Data are the average of 2 independent transfection experiments performed in triplicate.(B) Transwell migration assay of OPM2 cells, 24 h after transfection with miR-29b or scrambled oligonucleotides (NC), in the presence or absence of 10 ng/mL IL-8 added to the lower chamber of the transwell.(C). Quantitative RT-PCR of IL-8, MMP2 and VEGF-A, 24 h after transfection of OPM2 cells with synthetic miR-29b or scrambled oligonucleotides (NC). *P < 0.05, °P < 0.01.(D) Adhesion assay on HS-5 BM stromal cells performed with OPM2 cells, 24 h after transfection of MM cells with miR-29b or scrambled (NC) controls. Cells were stained, photographed under a light microscope equipped with a digital camera (original magnification, 20×) and then counted, as detailed in the “Materials and Methods”.(E) Quantitative RT-PCR of IL-8 and VEGF-A expression in HS-5 cells treated for 24 h with conditioned medium from OPM2 cells (0.5 × 10⁶), collected 24 h after transfection with synthetic miR-29b or scrambled oligonucleotides (NC). *P < 0.01.
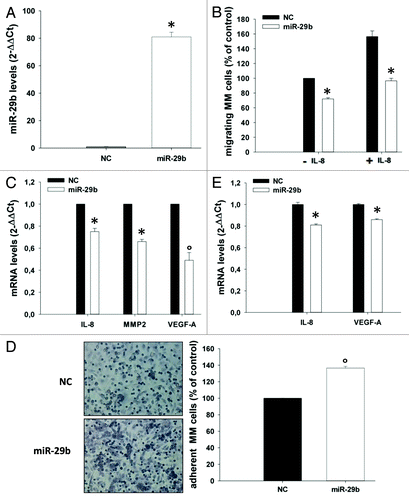
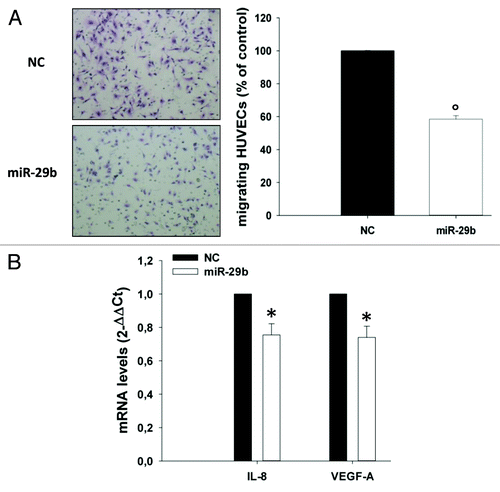
Figure 6. miR-29b inhibits endothelial cell migration.(A) Transwell migration assay of HUVEC cells. HUVECs were incubated for 6 h using as chemo-attractant conditioned medium of OPM2 cells, collected 24 h after transfection with synthetic miR-29b mimics or scrambled oligonucleotides; migrating cells were quantified as indicated in materials and methods. A representative picture of migrating cells is shown (original magnification, 20×).(B) Quantitative RT-PCR of IL-8 and VEGF-A mRNA levels in HUVEC cells treated for 24 h with conditioned medium from OPM2 cells, collected 24 h after transfection with synthetic miR-29b or scrambled oligonucleotides (NC). *P < 0.05, °P < 0.01.