Figures & data
Figure 1. Dynamics of H3.1 and H3.3 deposition in proliferating and senescent human cells. (A) Fluorescent microscopy visualization of H3.1- and H3.3-SNAP-HAx3 after in vivo labeling assays of MRC5 human primary cells with red fluorescent TMR-Star in pulse, quench–pulse, and quench–chase–pulse experiments. The pulse labels pre-existing H3-SNAP, the quench-pulse quenches pre-existing H3-SNAP with nonfluorescent block preventing their subsequent labeling with TMR-Star (background), and the quench–chase–pulse labels new H3-SNAP synthesized during the 3h30 chase. In all cases, HA stains total histone H3. DAPI stains nuclei. Scale bar is 10 μm. (See also Fig.S1). (B) Western blot analysis of whole cell extracts from MRC5 stably expressing H3.1- or H3.3 SNAP-HAx3 (e-H3.1 and e-H3.3, respectively) and transduced with an empty retroviral vector (empty) or with a vector expressing H-RasV12 (Ras) for 10 d. 25 μg of protein extracts were loaded. HA and Ras stainings verified expression of the transduced proteins. Mcm7 was used as a marker for cell proliferation and p16 as a marker for proliferation arrest. Smc-1 served as a loading control. M, molecular weight marker. (See also Fig.S2A–C). (C) Fluorescent microscopy visualization of new H3.1 and H3.3 (TMR, red) after in vivo labeling of MRC5 e-H3.1 and e-H3.3 treated as in (B) in a quench–chase–pulse experiment. HA (green) stains total H3 histones and DAPI stains nuclei. Scale bar is 10 μm. (See also Fig.S2D). (D) Histogram shows quantitative analysis of the proportion of TMR-positive cells in MRC5 e-H3.1 or e-H3.3 proliferating (empty) and senescent (Ras) cells. Numbers represent the mean of 3 independent experiments ± s.d.
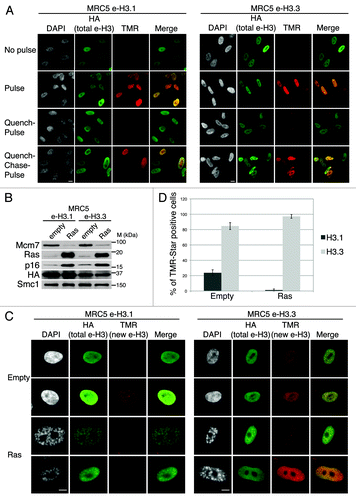
Figure 2. New H3.3 deposition does not occur into SAHF, in contrast to parental H3.1, but correlates with transcriptional activity in human senescent cells. (A) Fluorescent microscopy visualization of pre-existing H3.1 (HA, green) in MRC5 e-H3.1 cells proliferating (empty) or induced into senescence with H-RasV12 overexpression (Ras) for 8 d. H3K9me3 (red) and DAPI were used as markers for SAHF formation. Scale bar is 10 μm. (B) Graphics show fluorescent intensity profiles quantified by ImageJ along lines drawn through nuclei as shown in (A). (C) Fluorescent microscopy visualization of nascent global RNA transcription in vivo in MRC5 cells treated as in (A). Nascent RNAs were labeled with 5-ethynyl uridine (EU) for 3 h and revealed by the Click-iT chemistry (red). H3K9me3 (green) and DAPI were used as markers for SAHF formation. Scale bar is 10 μm. (D) Graphics show fluorescent intensity profiles quantified using ImageJ along lines drawn through nuclei as shown in (C). (E) Fluorescent microscopy visualization of new H3.3 (TMR, red) after in vivo labeling of MRC5 e-H3.3 cells treated as in (A) in a quench–chase–pulse experiment. H3K9me3 (green) and DAPI were used as markers for SAHF formation. Scale bar is 10 μm. (See also Fig.S3CandD). (F) Graphics show fluorescent intensity profiles quantified by ImageJ along lines drawn through nuclei as shown in (E).
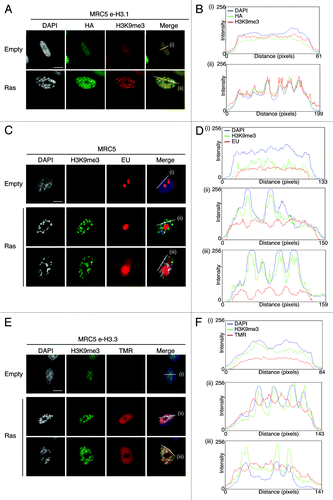
Figure 3. New H3.3 localizes in PML-NBs together with DAXX and ATRX in proliferating and senescent cells. (A) Fluorescent microscopy visualization of new H3.3 (TMR, red) after in vivo labeling of proliferating (empty) or senescent (Ras) MRC5 e-H3.3 cells in a quench–chase–pulse experiment. Co-staining with DAXX (green) and PML (cyan, pseudo-color) shows colocalization of new H3.3 with its chaperone DAXX in PML-NBs. Merge images represent PML in blue, DAXX in green, and new H3.3 (TMR) in red. Scale bar is 10 μm. (See also Fig.S4AandB). (B) Graphics show fluorescent intensity profiles quantified using ImageJ along lines drawn through nuclei as shown in (A). (C) Fluorescent microscopy visualization of new H3.3 (TMR, red) after in vivo labeling of MRC5 e-H3.3 cells treated as in (A) in a quench–chase–pulse experiment. Co-staining with ATRX (green) and PML (cyan, pseudo-color) shows colocalization of new H3.3 with its chaperone ATRX in PML-NBs. Merge images represent PML in blue, ATRX in green, and new H3.3 (TMR) in red. Scale bar is 10 μm. (D) Graphics show fluorescent intensity profiles quantified by ImageJ along lines drawn through nuclei as shown in (C). (E) Immunoprecipitation performed against HA tag on 150 μg of nuclear cell extracts from regular MRC5 cells (negative control) or MRC5 e-H3.1 or e-H3.3. Cells were either proliferating (empty) or induced into senescence by overexpression H-RasV12 (Ras) for 8 d. Input is 10% of the immunoprecipitated material. Membranes were probed for HA as a control for IP, for Mcm7 as a marker of cell proliferation and negative control for IP, and for DAXX and ATRX. M, molecular weight marker.
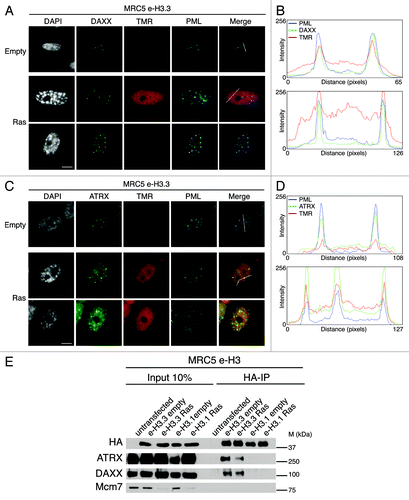
Figure 4. New H3.3 is lost from PML-NBs in DAXX-depleted cells. (A) Scheme for the assay of in vivo labeling of new H3.3 in MRC5 e-H3.3 induced into senescence and depleted of specific histone H3.3 chaperones. (B) Western blot analysis of total cell extracts from MRC5 e-H3.3 treated as in (A). Membranes were probed for HA and Ras to verify expression of the transduced proteins, and for DAXX and ATRX. Smc1 served as a loading control. M, molecular weight marker. (C) Fluorescent microscopy visualization of new H3.3 (TMR, red) after in vivo labeling of MRC5 e-H3.3 cells treated as in (A) in a quench–chase–pulse experiment. Co-staining with PML (green) shows loss of new H3.3 at PML-NBs upon DAXX depletion. Insets represent enlarged images (3×) of selected area. Scale bar is 10 μm. (See also Fig.S7). (D) Histogram shows quantitative analysis of the proportion of cells showing new H3.3 localization at PML-NBs. Numbers represents the mean of 3 independent experiments ± s.d.
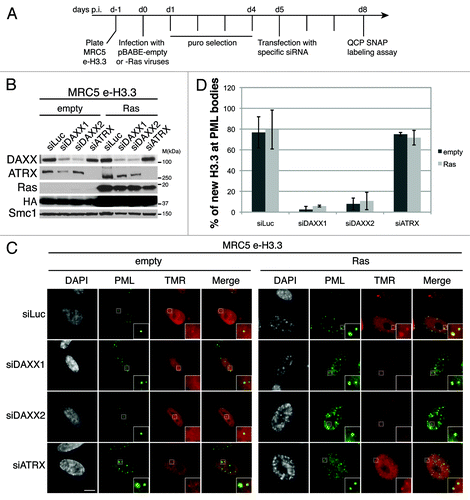
Figure 5. Overexpression of DAXX increases new H3.3 localization at PML-NBs (A) (Left panel) Fluorescent microscopy visualization of new H3.3 (TMR, red) after in vivo labeling of MRC5 e-H3.3 cells in a quench–chase–pulse experiment. MRC5 e-H3.3 cells transduced with an empty vector (Empty) or a vector expressing Myc-DAXX (Myc-DAXX) were co-stained with Myc (green) and PML (cyan, pseudo-color). Scale bar is 10 μm. (Right panel) Graphics show distribution of new H3.3 (TMR) signal in MRC5 e-H3.3. TMR fluorescence intensity of each pixel delimited within the nuclei is plotted in a 3D-surface plot and shows increase in the targeting of new H3.3 at PML-NBs upon DAXX overexpression. (See also Fig.S10A). (B) Western blot analysis of total cell extracts from MRC5 e-H3.3 treated as in (A) or as in (C). Membranes were probed for HA and Myc to verify expression of the transduced proteins, and for DAXX. α-Tubulin is a loading control. M, molecular weight marker. (C) (Left panel) Fluorescent microscopy visualization of new H3.3 (TMR, red) after in vivo labeling of MRC5 e-H3.3 cells in a quench–chase–pulse experiment. Control MRC5 e-H3.3 cells and MRC5 e-H3.3 cells co-expressing a siRNA resistant form of Myc-DAXX were transfected for 2 d with the indicated siRNAs before labeling with TMR and co-staining with Myc (green) and DAXX (cyan, pseudo-color). Scale bar is 10 μm. (Right panel) Graphics showing distribution of new H3.3 (TMR) signal intensity as in (A), reveals rescue of new H3.3 localization to PML-NBs upon re-expression of DAXX. (D) Histogram shows quantitative analysis of the proportion of cells showing new H3.3 localization at PML-NBs. Numbers represent the mean of 2 independent experiments ± s.d.
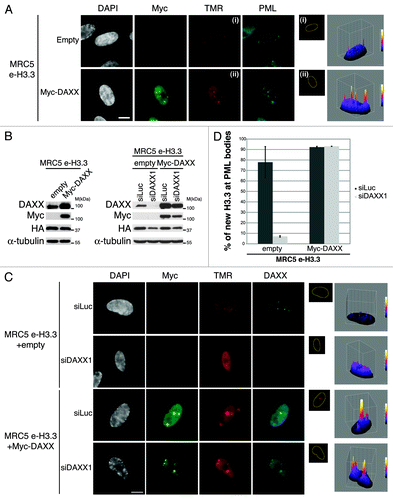
Figure 6. Overexpression of DAXX triggers formation of large PML-NBs together with an accumulation of HP1 proteins in these nuclear bodies. (A) Western blot analysis of total cell extracts from MRC5 cells transduced with an empty vector or a vector expressing Myc-DAXX. Membranes were probed for Myc to verify expression of the transduced proteins, and for DAXX. α-Tubulin is a loading control. M, molecular weight marker. (B) Fluorescent microscopy visualization of PML (green) and DAXX (red) in MRC5 cells treated as in (A) shows formation of large PML-NBs upon Myc-DAXX overexpression (white arrowheads). Scale bar is 10 μm. (C) Fluorescent microscopy visualization of nascent global RNA transcription in vivo in MRC5 cells empty or overexpressing Myc-DAXX. Nascent RNAs were labeled with 5-ethynyl uridine (EU) for 3 h and revealed by the Click-iT chemistry (red). Co-staining with Myc (green) and PML (cyan, pseudo-color) shows absence of transcription within the large PML-NBs upon overexpression of DAXX. Insets represent enlarged images (3×) of selected area. Scale bar is 10 μm. (D and E) Fluorescent microscopy visualization of Myc-DAXX (Myc, green) and HP1γ or H3K9me3 (red) in MRC5 cells treated as in (A) shows accumulation of HP1γ (D) in absence of H3K9me3 (E) in the large PML-NBs upon overexpression of Myc-DAXX (white arrowheads). Scale bar is 10 μm.
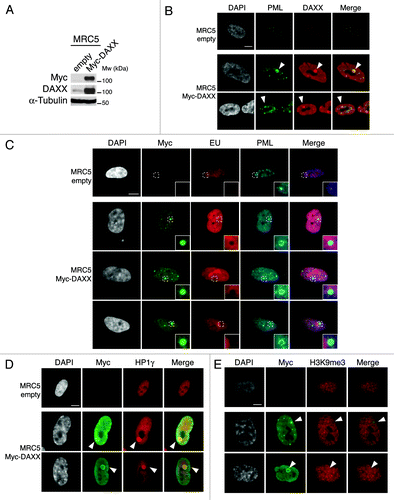
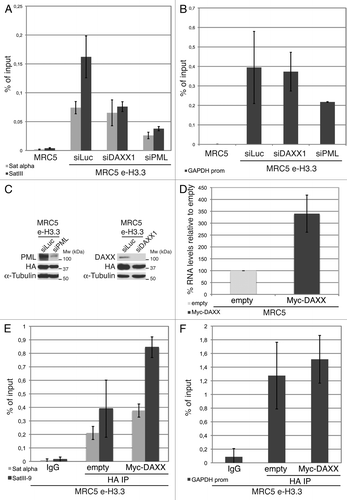
Figure 7. Enrichment of H3.3 in pericentromeric heterochromatin is dependent on DAXX and PML proteins (A) Histogram shows analysis of H3.3 incorporation in centromeric (satellite α) or pericentromeric heterochromatin (satellite III) by ChIP against the HA epitope in MRC5 e-H3.3 cells treated for 72 h with the indicated siRNAs. QPCR data are presented as fold enrichment of IP over input DNA. MRC5 untransduced cells serve as a negative control. Numbers represent the mean of 2 independent experiments ± s.d. (B) Histogram shows analysis of H3.3 incorporation at the GAPDH promoter region by ChIP assay performed as in (A). Numbers represent the mean of 2 independent experiments ± s.d. (C) Western blot analysis of total cell extracts from MRC5 e-H3.3 cells treated as in (A). Membranes were probed for PML and DAXX to verify depletion of these proteins, and for HA to verify expression of the transduced proteins. α-tubulin is a loading control. M, molecular weight marker. (D) Satellite III mRNA expression levels in empty MRC5 cells or MRC5 cells overexpressing Myc-DAXX as determined by quantitative RT-PCR. mRNA levels were normalized to the reference gene GAPDH and levels were set to 100% in empty cells. Numbers represent the mean of 3 independent experiments ± s.d. (E) Histogram shows analysis of H3.3 incorporation in centromeric (satellite α) or pericentromeric heterochromatin (satellite III) by ChIP against the HA epitope in MRC5 e-H3.3 cells transduced with an empty vector (empty) or a vector encoding Myc-DAXX (Myc-DAXX). QPCR data are presented as fold enrichment of IP over input DNA. IP with IgG control antibody in MRC5 e-H3.3 cells serves as a negative control. Numbers represent the mean of 2 independent experiments ± s.d. (F) Histogram shows analysis of H3.3 incorporation at the GAPDH promoter region by ChIP assay performed as in (E). Numbers represent the mean of 2 independent experiments ± s.d.