1,839
Views
52
CrossRef citations to date
0
Altmetric
Report

Evidences that estrogen receptor α interferes with adiponectin effects on breast cancer cell growth

, , , , , , , , , & show all
Pages 553-564 | Received 19 Sep 2013, Accepted 06 Dec 2013, Published online: 12 Dec 2013

Figures & data

Figure 1. Effects of adiponectin on breast cancer cell growth. (A) MTT growth assays in MCF-7, T47D, MDA-MB-231, and SKBR-3 cells treated with vehicle (C) or adiponectin 1 (A1) or 5 μg/ml (A5) for 72 h. Cell proliferation is expressed as fold change ± SD relative to vehicle-treated cells and is representative of 3 different experiments each performed in triplicate. (B) Soft agar growth assay in MCF-7 and MDA-MB-231 cells plated in 0.35% agarose and treated as indicated above. After 14 d of growth colonies >50 µm diameter were counted. (C) MCF-7 3-dimensional cultures were untreated or treated as indicated for 48 h and then photographed under phase-contrast microscopy. (D) Cell numbers obtained from 3-dimensional spheroids in MCF-7 cells treated as indicated for 48 h. (E) MCF-7 cells exposed to ICI 182 780, or transfected in suspension with 30 nM siRNAs/well (ERα siRNA or a scrambled siRNA for control samples), were treated with vehicle (C) or A1 or A5 for 72 h before testing cell viability using MTT assay. Results are expressed as fold change ± SD relative to vehicle-treated cells and are representative of 3 different experiments, each performed in triplicate. *P < 0.05 compared with vehicle.
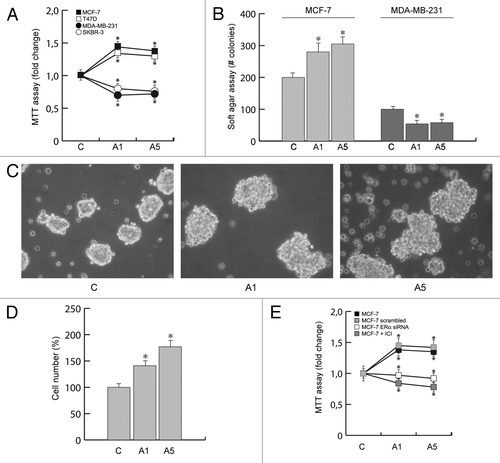
Figure 1. Effects of adiponectin on breast cancer cell growth. (A) MTT growth assays in MCF-7, T47D, MDA-MB-231, and SKBR-3 cells treated with vehicle (C) or adiponectin 1 (A1) or 5 μg/ml (A5) for 72 h. Cell proliferation is expressed as fold change ± SD relative to vehicle-treated cells and is representative of 3 different experiments each performed in triplicate. (B) Soft agar growth assay in MCF-7 and MDA-MB-231 cells plated in 0.35% agarose and treated as indicated above. After 14 d of growth colonies >50 µm diameter were counted. (C) MCF-7 3-dimensional cultures were untreated or treated as indicated for 48 h and then photographed under phase-contrast microscopy. (D) Cell numbers obtained from 3-dimensional spheroids in MCF-7 cells treated as indicated for 48 h. (E) MCF-7 cells exposed to ICI 182 780, or transfected in suspension with 30 nM siRNAs/well (ERα siRNA or a scrambled siRNA for control samples), were treated with vehicle (C) or A1 or A5 for 72 h before testing cell viability using MTT assay. Results are expressed as fold change ± SD relative to vehicle-treated cells and are representative of 3 different experiments, each performed in triplicate. *P < 0.05 compared with vehicle.

Figure 2. Adiponectin induces MAPK activation through the formation of a multimeric protein complex. Five hundred micrograms of protein lysates from MCF-7 cells, untreated (C) or treated with A1 or A5 for 15 min (A) or 48 h (B), were immunoprecipitated with an APPL1 antibody and then blotted with the indicated antibodies on the right. To verify equal loading, the membrane was probed with anti-APPL1 antibody. Normal rabbit IgG was used as a negative control to precipitate A5-treated samples. Numbers on top of the blots represent the average fold change vs. untreated cells. One of 3 similar experiments is presented. (C) MCF-7 cells, treated with adiponectin for 15 min, were lysed and immunoprecipitated with an anti-APPL1 antibody/protein A/G complex and assayed for c-Src-kinase activity using acid-treated enolase as described in “Materials and Methods”. These results are representative of 3 independent experiments. c-Src and enolase position is indicated. (D) pIGF-IRTyr1131 levels in MCF-7 cells treated with vehicle (−) or A1 and A5 as reported in absence or presence of ERα siRNA. (E) Total cellular proteins were isolated from MCF-7 cells in the absence or presence of ERα, IGF-IR, or APPL1 siRNA or pre-treated with PP2 or H89 and treated with A1 and A5. pMAPK, levels were evaluated by immunoblotting. Total MAPK was used as a loading control. (F) ERα, IGF-IR, and APPL1 levels were shown as control of silencing. Western blotting showed are representative of 3 different experiments.
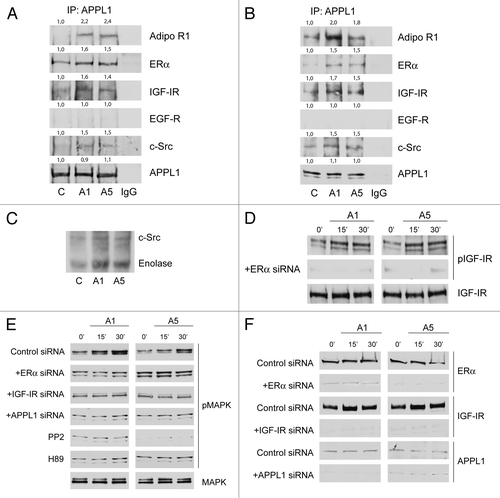
Figure 2. Adiponectin induces MAPK activation through the formation of a multimeric protein complex. Five hundred micrograms of protein lysates from MCF-7 cells, untreated (C) or treated with A1 or A5 for 15 min (A) or 48 h (B), were immunoprecipitated with an APPL1 antibody and then blotted with the indicated antibodies on the right. To verify equal loading, the membrane was probed with anti-APPL1 antibody. Normal rabbit IgG was used as a negative control to precipitate A5-treated samples. Numbers on top of the blots represent the average fold change vs. untreated cells. One of 3 similar experiments is presented. (C) MCF-7 cells, treated with adiponectin for 15 min, were lysed and immunoprecipitated with an anti-APPL1 antibody/protein A/G complex and assayed for c-Src-kinase activity using acid-treated enolase as described in “Materials and Methods”. These results are representative of 3 independent experiments. c-Src and enolase position is indicated. (D) pIGF-IRTyr1131 levels in MCF-7 cells treated with vehicle (−) or A1 and A5 as reported in absence or presence of ERα siRNA. (E) Total cellular proteins were isolated from MCF-7 cells in the absence or presence of ERα, IGF-IR, or APPL1 siRNA or pre-treated with PP2 or H89 and treated with A1 and A5. pMAPK, levels were evaluated by immunoblotting. Total MAPK was used as a loading control. (F) ERα, IGF-IR, and APPL1 levels were shown as control of silencing. Western blotting showed are representative of 3 different experiments.

Figure 3. Time course of MAPK activation upon adiponectin exposure in MDA-MB-231 cells ectopically expressing membrane ERα. MDA-MB-231 (A) and MDA-MB-231 transfected with a plasmid codifying for membrane ERα (B) were serum-starved for 24 h followed by treatment with adiponectin 1 or 5 μg/ml for the indicated times. Western blots show the phosphorylation status of MAPK. Total MAPK is used as a loading control. One of 3 similar experiments is presented
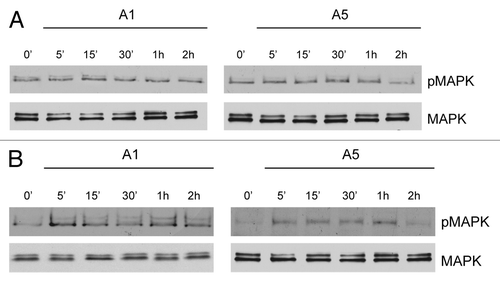
Figure 3. Time course of MAPK activation upon adiponectin exposure in MDA-MB-231 cells ectopically expressing membrane ERα. MDA-MB-231 (A) and MDA-MB-231 transfected with a plasmid codifying for membrane ERα (B) were serum-starved for 24 h followed by treatment with adiponectin 1 or 5 μg/ml for the indicated times. Western blots show the phosphorylation status of MAPK. Total MAPK is used as a loading control. One of 3 similar experiments is presented

Figure 4. Effects of adiponectin on ERα transactivation. (A) Total cellular proteins were isolated from MCF-7 cells treated with A1 and A5 for 48 h. pMAPK, levels were evaluated by immunoblotting. Total MAPK was used as a loading control. (B) MCF-7 cells were transfected with the luciferase reporter plasmid XETL. HeLa cells were cotransfected with XETL and HEGO plasmids. The cells were untreated or treated for 48 h with A1 and A5 or 100 nM E2, used as positive control. (C) MCF-7 cells were transfected with the luciferase reporter plasmid XETL. The cells were untreated or treated for 48 h with A1 and A5 or in combination with Compound C (CC), H89, PP2, or PD98059. *P < 0.05 compared with control (−); P < 0.05 compared with A1; P < 0.05 compared with A5. (D) MCF-7 cells were transfected with XETL plasmid in the absence or presence of IGF-IR siRNA and treated with adiponectin for 48 h. *P < 0.05 compared with control (−). The values represent the means ± SD of 3 different experiments. In each experiment, the activities of the transfected plasmids were assayed in triplicate transfections.
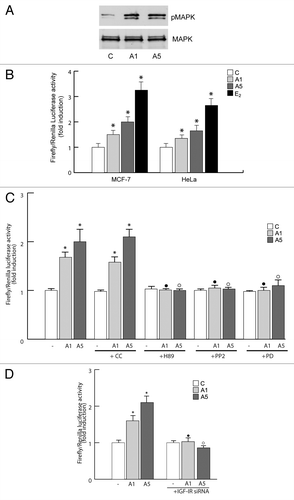
Figure 4. Effects of adiponectin on ERα transactivation. (A) Total cellular proteins were isolated from MCF-7 cells treated with A1 and A5 for 48 h. pMAPK, levels were evaluated by immunoblotting. Total MAPK was used as a loading control. (B) MCF-7 cells were transfected with the luciferase reporter plasmid XETL. HeLa cells were cotransfected with XETL and HEGO plasmids. The cells were untreated or treated for 48 h with A1 and A5 or 100 nM E2, used as positive control. (C) MCF-7 cells were transfected with the luciferase reporter plasmid XETL. The cells were untreated or treated for 48 h with A1 and A5 or in combination with Compound C (CC), H89, PP2, or PD98059. *P < 0.05 compared with control (−); ●P < 0.05 compared with A1; ○P < 0.05 compared with A5. (D) MCF-7 cells were transfected with XETL plasmid in the absence or presence of IGF-IR siRNA and treated with adiponectin for 48 h. *P < 0.05 compared with control (−). The values represent the means ± SD of 3 different experiments. In each experiment, the activities of the transfected plasmids were assayed in triplicate transfections.

Figure 5. Effects of adiponectin on ERα functional domains. (A and C) Schematic illustration of ER constructs used for the experiments. HEGO is a wild-type ER-expressing vector that encodes a 595-amino acid protein. HE15-(1–282) contains AF-1 and the DNA binding domain (DBD). HE19-(179–95) contains DBD, and AF-2 domains. HE241G encodes a mutated ERα, which has the nuclear localization sequence deleted (250–303). ER plasmids mutated in serine residues 104, 106, 118, and 167 to Ala. (B) HeLa cells were transiently cotransfected with XETL and either HEGO or PSG5/HE15 (AF-1) or PSG5/HE19 (AF-2) or HE241G plasmids. (D) HeLa cells were transiently cotransfected with XETL and either HEGO or Ser-104/106/118A-ER or Ser-118A-ER or Ser-167A-ER. The cells were treated for 48 h in the absence (C) or in the presence of A1 and A5 or E2 (100 nM) used as positive control. The values represent the means ± SD of 3 different experiments. In each experiment, the activities of the transfected plasmids were assayed in triplicate transfections. *P < 0.05, **P < 0.01 compared with (C). (E) Total extracts from cells treated with A1 or A5 for 30 min were analyzed for phosphorylation of serines 118 and 167 (pS118 and pS167) and expression of ERα by immunoblot analysis. GAPDH was used as a control for equal loading and transfer.
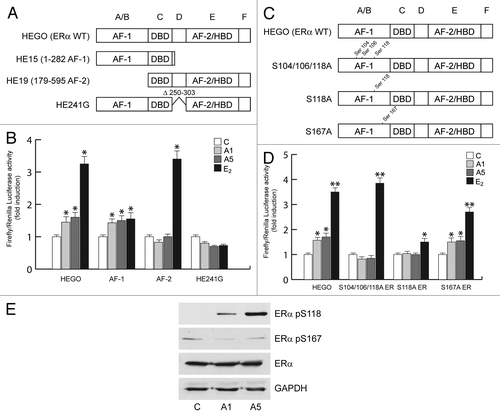
Figure 5. Effects of adiponectin on ERα functional domains. (A and C) Schematic illustration of ER constructs used for the experiments. HEGO is a wild-type ER-expressing vector that encodes a 595-amino acid protein. HE15-(1–282) contains AF-1 and the DNA binding domain (DBD). HE19-(179–95) contains DBD, and AF-2 domains. HE241G encodes a mutated ERα, which has the nuclear localization sequence deleted (250–303). ER plasmids mutated in serine residues 104, 106, 118, and 167 to Ala. (B) HeLa cells were transiently cotransfected with XETL and either HEGO or PSG5/HE15 (AF-1) or PSG5/HE19 (AF-2) or HE241G plasmids. (D) HeLa cells were transiently cotransfected with XETL and either HEGO or Ser-104/106/118A-ER or Ser-118A-ER or Ser-167A-ER. The cells were treated for 48 h in the absence (C) or in the presence of A1 and A5 or E2 (100 nM) used as positive control. The values represent the means ± SD of 3 different experiments. In each experiment, the activities of the transfected plasmids were assayed in triplicate transfections. *P < 0.05, **P < 0.01 compared with (C). (E) Total extracts from cells treated with A1 or A5 for 30 min were analyzed for phosphorylation of serines 118 and 167 (pS118 and pS167) and expression of ERα by immunoblot analysis. GAPDH was used as a control for equal loading and transfer.

Figure 6. Adiponectin actions on cellular localization and expression of ERα. (A) MCF-7 cells were incubated in serum-free medium for 96 h and then treated with vehicle (C), A1, A5, or 100 nM E2, used as positive control, for 24 h. No immunodetection was observed replacing the anti-ER antibody with an irrelevant mouse IgG (NC). Each experiment is representative of at least 10 tests. (B) RT-PCR of ERα mRNA. MCF-7 cells were stimulated for 48 h with A1 and A5 or E2 (100 nM); 36B4 mRNA levels were determined as a control. (C) Immunoblot of ERα from MCF-7 cells treated as above; GAPDH serves as loading control. (D) RT-PCR of Catepsin D (CatD) and pS2 mRNA. MCF-7 cells were treated as reported. The histograms represent the mean ± SD of 3 separate experiments, in which band intensities were evaluated in terms of optical density arbitrary units and expressed as the percentage of the control assumed as 100%. *P < 0.05 vs. control.
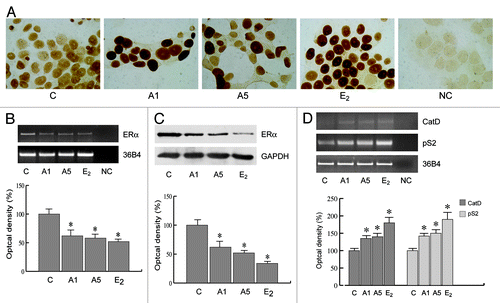
Figure 6. Adiponectin actions on cellular localization and expression of ERα. (A) MCF-7 cells were incubated in serum-free medium for 96 h and then treated with vehicle (C), A1, A5, or 100 nM E2, used as positive control, for 24 h. No immunodetection was observed replacing the anti-ER antibody with an irrelevant mouse IgG (NC). Each experiment is representative of at least 10 tests. (B) RT-PCR of ERα mRNA. MCF-7 cells were stimulated for 48 h with A1 and A5 or E2 (100 nM); 36B4 mRNA levels were determined as a control. (C) Immunoblot of ERα from MCF-7 cells treated as above; GAPDH serves as loading control. (D) RT-PCR of Catepsin D (CatD) and pS2 mRNA. MCF-7 cells were treated as reported. The histograms represent the mean ± SD of 3 separate experiments, in which band intensities were evaluated in terms of optical density arbitrary units and expressed as the percentage of the control assumed as 100%. *P < 0.05 vs. control.

Figure 7. Involvement of the protein complex in the adiponectin-induced MCF-7 cell growth. MTT growth assays in MCF-7 cells untreated or treated for 72 h with A1 and A5 in the absence or presence of ERα, IGF-IR, or APPL1 siRNA, or in combination with PP2, H89, or PD98059 inhibitor of c-Src, PKA, and MAPK, respectively. Cell proliferation is expressed as fold change ± SD relative to vehicle treated cells, and is representative of 3 different experiments each performed in triplicate. *P < 0.05 compared with control (−); P < 0.05 compared with A1; P < 0.05 compared with A5.

Figure 7. Involvement of the protein complex in the adiponectin-induced MCF-7 cell growth. MTT growth assays in MCF-7 cells untreated or treated for 72 h with A1 and A5 in the absence or presence of ERα, IGF-IR, or APPL1 siRNA, or in combination with PP2, H89, or PD98059 inhibitor of c-Src, PKA, and MAPK, respectively. Cell proliferation is expressed as fold change ± SD relative to vehicle treated cells, and is representative of 3 different experiments each performed in triplicate. *P < 0.05 compared with control (−); ●P < 0.05 compared with A1; ○P < 0.05 compared with A5.
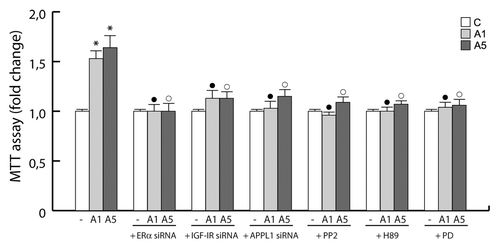
Figure 8. Proposed model of adiponectin-induced proliferation in ERα-positive breast cancer cells. Globular adiponectin binds to AdipoR1, which interacts with the adaptor protein APPL1, through the intracellular N terminus. Adiponectin induces physical interaction between AdipoR1/APPL1, membrane ERα, IGF-IR, and c-Src, leading to MAPK phosphorylation. This contributes to ERα activation at genomic level through the phosphorylation at Ser118. Consequently, adiponectin, increasing ERα transactivation, positively affects MCF-7 cell growth.
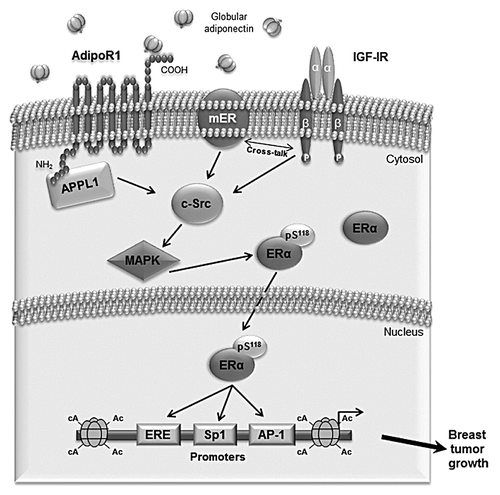
Figure 8. Proposed model of adiponectin-induced proliferation in ERα-positive breast cancer cells. Globular adiponectin binds to AdipoR1, which interacts with the adaptor protein APPL1, through the intracellular N terminus. Adiponectin induces physical interaction between AdipoR1/APPL1, membrane ERα, IGF-IR, and c-Src, leading to MAPK phosphorylation. This contributes to ERα activation at genomic level through the phosphorylation at Ser118. Consequently, adiponectin, increasing ERα transactivation, positively affects MCF-7 cell growth.

Reprints and Corporate Permissions

Please note: Selecting permissions does not provide access to the full text of the article, please see our help page How do I view content?

To request a reprint or corporate permissions for this article, please click on the relevant link below:

Academic Permissions

Please note: Selecting permissions does not provide access to the full text of the article, please see our help page How do I view content?

Obtain permissions instantly via Rightslink by clicking on the button below:

If you are unable to obtain permissions via Rightslink, please complete and submit this Permissions form. For more information, please visit our Permissions help page.