Figures & data
Figure 1. Body weight. Effect of BTZ (0.20 mg/kg) treatment on the body weight of rats during the chronic in vivo study. No significant difference of body weight as observed at any time point (mean ± SEM).
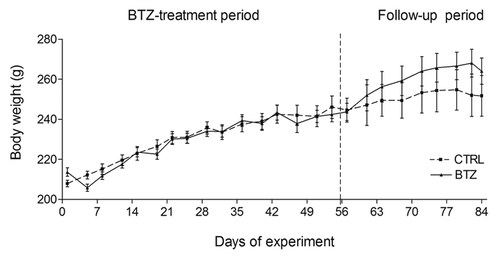
Figure 2. Neurophysiological studies. BTZ-induced decrease of the NCV was observed after 8 wk of chronic administration as well as at the end of the 4-wk follow up period (P < 0.01 vs. CTRL and CTRL-FU) (mean ± SEM).
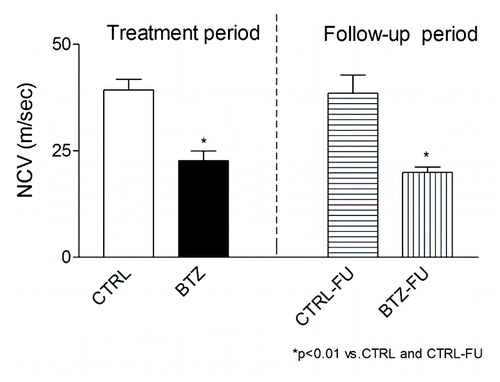
Figure 3. Light microscopy analysis. BTZ-induced morphological alteration in sciatic and caudal nerves. Axonal degeneration with loss of fiber density was evident in myelinated fibers of peripheral nerves, particularly in the caudal nerve at the end of BTZ treatment. CTRL (A and B), 8 wk-BTZ-treated (C and D) and follow-up rats (E and F). The arrows show axonal degeneration of myelinated fibers (scale bar = 10 μm).
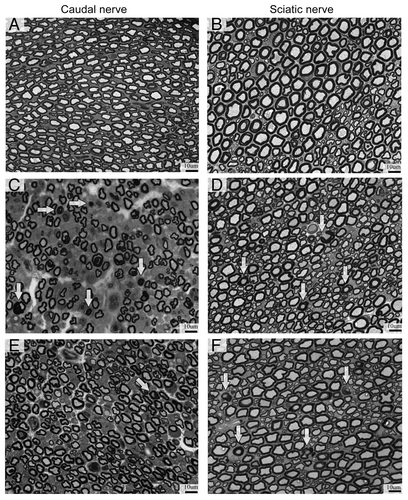
Figure 4. Effect of BTZ on frequency distribution (A) and morphometrical measures (B) of myelinated fibers in the sciatic nerve in control and BTZ-treated groups. CTRL, control; BTZ, animals treated for 8 wk; BTZ-FU, animals after 4 wk of washout period.*P < 0.001 vs. CTRL; °P < 0.001 vs. BTZ-FU.
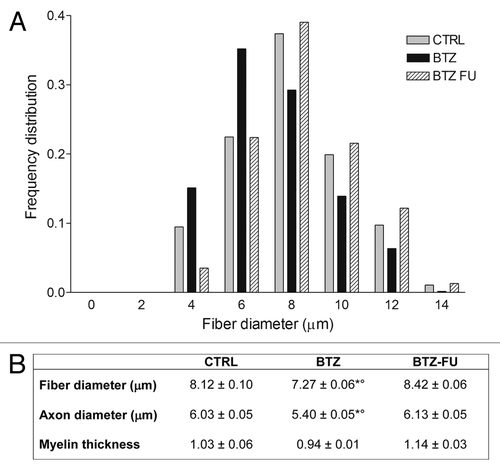
Table 1. Morphometrical analysis of DRG neurons
Figure 5. Characterization of the time course of proteasome inhibition after single and repeated BTZ administrationsin different tissues. The graph shows the % of proteasome inhibition after single BTZ administration (acute treatment), 1 h after the 24th administration (8th week) (chronic treatment) and at the end of the 4-wk follow-up period (BTZ-FU). Proteasome inhibition rate (PI%) in sample tissue lysates from treated vs. control rats was calculated as % A = FBTZ-FSUBSTRATE/FCTRL-FSUBSTRATE, and the inhibition was obtained as 100*(1-A). (A) Peripheral blood mononuclear cell (PBMC), (B) DRG, (C) sciatic nerve, (D) brain tissues (mean ± SEM).
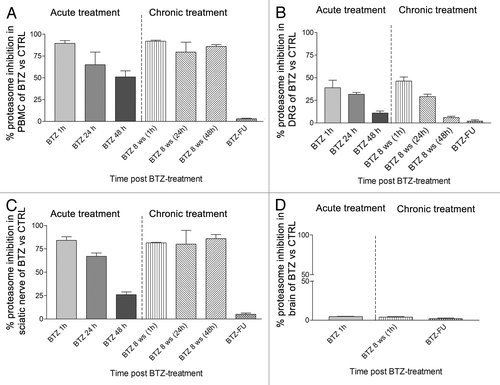
Figure 6. In vivo tubulin polymerization in sciatic nerve after chronic BTZ treatment. The immunoblotting analysis performed on sciatic nerve showed a significant increase of polymerized tubulin after 8 wk of BTZ treatment compared with the controls and the follow-up rats (*P < 0.05 vs. CTRL and BTZ-FU) (P, polymerized tubulin fraction; S, soluble free tubulin fraction). Representative blots are shown on the left. On the right, western blot values of α-tubulin polymerization are expressed as mean ± SEM.
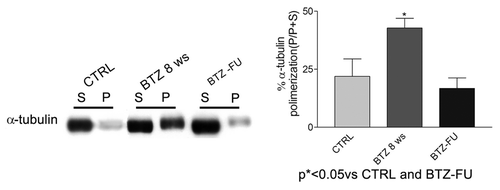
Figure 7. Effect of BTZ treatment on DRG neurons protesom activity. Embryonic (A) and adult (B) DRG neurons exposed to the indicated concentration of BTZ for 24 h and 48 h show a remarkable proteasome inhibition, persistent up to 48 h in adult neurons. Data are expressed as mean ± SEM.
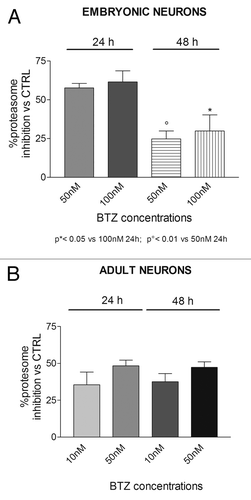
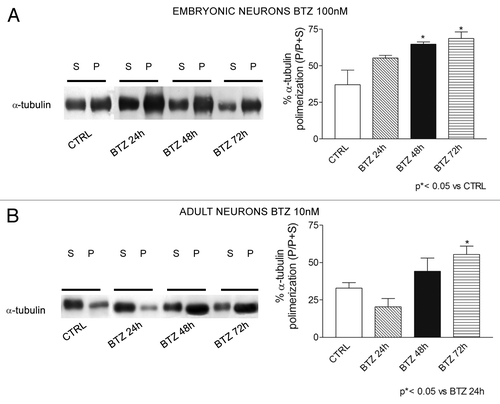
Figure 8. Effect of BTZ treatment on tubulin polymerization in DRG neuron cultures. Immunoblotting revealed induction of polymerized tubulin in neurons obtained from E15 embryonic neurons (A) and neurons from adult rats (B) after BTZ treatment. Embryonic and adult cells were exposed to 100 nM or 10 nM BTZ, respectively, for 24 h, 48 h, or 72 h, and polymerization of α-tubulin was assessed using western blot analysis. (P = polymerized tubulin fraction and S = soluble free tubulin fraction). Representative blots are shown on the left. On the right, western blot data were quantified and expressed as % P/(P+S) in BTZ treated cultures compared with control ones (mean ± SEM).