Figures & data
Figure 1. Effect of p53-reactivating drugs in mesothelioma cell lines. (A) Expression levels of p53 and p14ARF assessed by western blot in a panel of mesothelioma cell lines and in HMC-hTERT derived from normal mesothelium. The blot against p14 derives from a long exposure; no bands specific for p14 were observed in mesothelioma cell lines consistent to the fact that the CDKN2A locus is reported to be homozygously deleted on the COSMIC database (http://cancer.sanger.ac.uk/cancergenome/projects/cell_lines/) in NCI-H28, NCI-H2452, MSTO-211H and NCI-H2052. The size of the p53 band detected in NCI-H2452 is consistent with a protein truncation as previously reported.Citation23 GAPDH was used as a loading control. Representative blots are shown out of 3 independent western blot experiments. (B) TP53 mutational status was assessed through sequencing of the full-length encoding cDNA. The table reports the polymorphisms and/or mutations found. For NCI-H2452 no PCR amplification of cDNA was achieved with our strategy. (C) Left: MTS assay was performed in the indicated cell lines treated with several doses of RITA (top) and nutlin-3 (bottom). The results are reported as the means of 3 independent experiments, each conducted in triplicate, and expressed as percentages of cell viability (calculated with respect to the control cells treated with DMSO alone). The absorbance values of treated and control samples were subjected to 1-way Anova with Dunnett post-test. Statistically significant differences between treated and control cells are indicated with: *significant (P < 0.05); **very significant (P < 0.01); and ***extremely significant (P < 0.001). Right: the table reports the IC50 values of RITA for every cell line 24 h after treatment or 48 h for MSTO-211H; IC50 values for nutlin-3 were not determined (ND). (D) Long-term RITA effects were assessed by clonogenic assay. Colonies were stained with crystal violet 2 wk after a 24 h-treatment with RITA or DMSO as control. RITA was used at the IC50, as reported in , or, for NCI-H2052, with the maximum dose used. A representative experiment, out of 3 independent ones, is shown.
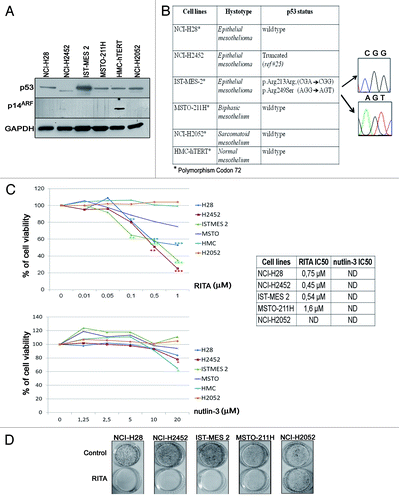
Figure 2. RITA and nutlin-3 show different effects on cell cycle and differently modulate p53 and p21 levels. (A) Cell cycle analysis of mesothelioma cell lines (NCI-H28, NCI-H2452, IST-MES 2, MSTO-211H, and NCI-H2052) and HMC-hTERT treated with RITA at its IC50 values and 10 μM nutlin-3 for 24 h. For NCI-H2052 and HMC-hTERT, RITA IC50 was not determinable, therefore these cell lines were treated with RITA at the maximum dose used (1.6 μM). The table reports the mean ± standard deviation values from 2 independent experiments. Raw data from both experiments are reported in Table S2. (B) p53, p21, and MDM2 protein levels were analyzed by western blot following cell treatment with 2 doses of RITA (IC50 and 0.1 μM) and nutlin-3 (10 μM and 20 μM) for 24 h. GAPDH was used as a loading control. Representative blots are shown out of 3 independent western blot experiments.
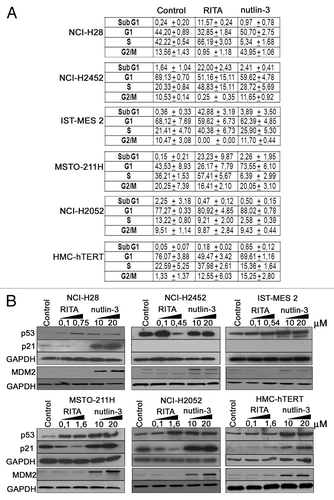
Figure 3. RITA triggers caspase- and p53-dependent apoptosis in mesothelioma cell lines carrying both wild-type and mutant p53. (A) NCI-H28, NCI-H2452, IST-MES 2, MSTO-211H, and NCI-H2052 were treated for 24 h with RITA (IC50), RITA (IC50) + Z-VAD-FMK (100 μM) or nutlin-3 (10 μM) and analyzed by annexin-V assay. NCI-H2052 were treated with the highest dose of RITA used (1.6 μM). The graphs show the percentages of early (population of cells positive for annexin-V staining) and late apoptosis (population of cells positive for both annexin-V and propidium iodide staining). A representative experiment, out of 2 independent ones, is shown. (B) The same mesothelioma cell lines were analyzed by MTS assay following treatment with RITA (IC50), pifithrin-α (25 μM), and RITA (IC50) + pifithrin-α (25 μM) for 24 h. Statistically significant differences were evaluated by Anova with Tukey post-test and indicated with: *significant (P < 0.05); **very significant (P < 0.01); and ***extremely significant (P < 0.001). The results are reported as the means of 3 independent experiments, each conducted in triplicate.
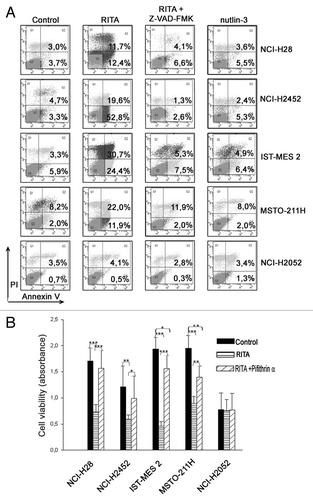
Figure 4. RITA and nutlin-3 effects on PARP and caspase-3 activation. NCI-H28, NCI-H2452, IST-MES 2, MSTO-211H, NCI-H2052, and HMC-hTERT were treated for 24 h with 2 doses of RITA (IC50 and 0.1 μM) and nutlin-3 (10 μM and 20 μM) or with RITA at the maximum dose used (1.6 μM) for NCI-H2052 and HMC-hTERT. PARP and caspase-3 protein levels were analyzed by western blot with antibodies detecting both the full-length and cleaved forms. GAPDH was used as a loading control. Representative blots are shown out of 3 independent western blot experiments.
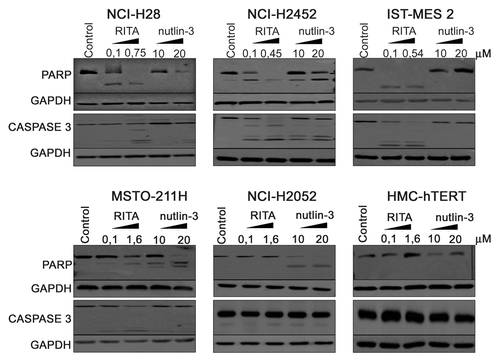
Figure 5. RITA is able to trigger apoptosis through mutant p.Arg249Ser p53. (A) HCT116 p53–/– were transfected with the pCEFL-HA vector expressing wt p53 cDNA (cloned from NCI-H28) or p.Arg249Ser p53 cDNA (cloned from IST-MES 2). Following 18 h from transfection, cells were treated with 1.6 μM RITA for 24 h then harvested and analyzed through the annexin-V assay; p53 expression levels in transfected cells were analyzed in parallel through western blot. GAPDH was used as a loading control. (B) HCT116 p53–/– were co-transfected with pCEFL-HA expressing wt p53 or p.Arg249Ser p53 and the PG13-luc or MG15-luc vectors carrying either wt or mutated p53 binding sequences upstream the luciferase reporter gene. The results represent the means of 3 independent experiments. Statistically significant differences were evaluated by Student t test and indicated with *(P < 0.05).
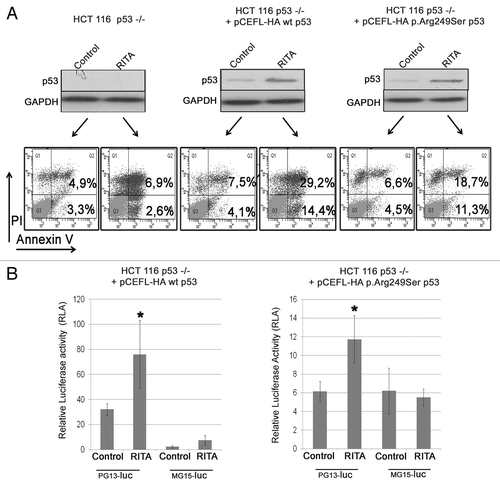
Figure 6. RITA suppresses mesothelioma cell growth in soft agar and in vivo. (A) MSTO-211H were seeded in 24-well plates containing semisolid medium (soft agar) and cultured with vehicle DMSO (control) or RITA IC50 (1.6 μM) for 2 wk. Colony formation was assessed by staining with NBT. Statistically significant differences were evaluated by Student t test and indicated with **(P < 0.01). (B) Growth curves of MSTO-211H xenografts in 2 groups of nude mice treated with vehicle DMSO or RITA, respectively. The graph represents the median values of the tumor volumes at each measurement. The length of drug treatments is indicated through the syringes. Statistically significant differences were evaluated by Mann–Whitney test and indicated with *(P < 0.05). + indicates P = 0.05. (C) Dot plots showing the median and interquartile range of the weights of tumors excised from the 2 groups of mice treated with DMSO or RITA. The P value obtained by the Mann–Whitney test is reported (P = 0.059).
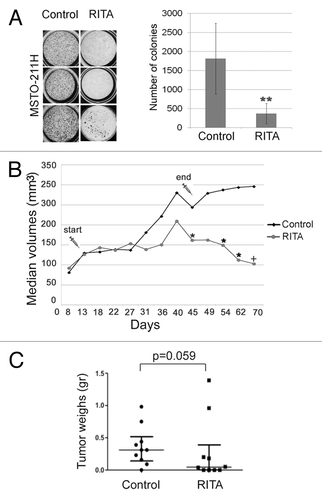
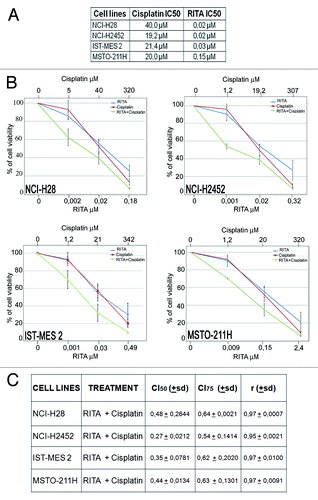
Figure 7. Synergistic effect of RITA–cisplatin combination. (A) The table reports the IC50 values at 72 h of RITA and cisplatin on mesothelioma cell lines, as determined through MTS analysis of cell viability. The results represent the means of 3 independent experiments, each conducted in triplicate. (B) Dose-response curves for RITA alone, cisplatin alone, and RITA–cisplatin combination in NCI-H28, NCI-H2452, IST-MES 2, and MSTO-211H. The results represent the means of 3 independent experiments, each conducted in triplicate. (C) The table reports the mean Combination Index (CI) values of the drug combination at 50% and 75% of cell killing (CI50 and CI75) following 72 h of treatment, calculated by the CalcuSyn software for each of the 3 independent experiment. CI values below 1 indicate strong synergism.