9,693
Views
639
CrossRef citations to date
0
Altmetric
Report

Partial inhibition of Cdk1 in G2 phase overrides the SAC and decouples mitotic events

, , , , &
Pages 1400-1412 | Received 02 Dec 2013, Accepted 02 Mar 2014, Published online: 06 Mar 2014

Figures & data

Figure 1. Effects of partial pre-mitotic Cdk1 inhibition. (A) Synchronized HeLa-H2B-mCherry cells were released from G1/S and treated at 6 h post-release (early G2 phase) with increasing doses of the Cdk1 inhibitor RO3306 (RO). Shown are characteristic fields of G2 and mitotic images captured, along with specific masks generated using the IncuCyte to count total cell number (green) and accurately identify mitotic cells (blue) based on differential H2B-mCherry intensity and shape. Scale bar = 200 µM (10 µM for zoom). (B) Data from (A) presented as a graph showing the percentage of mitotic cells at each time point. Images were taken every hour up to 20 h post-release from thymidine. Graph is representative of 3 independent experiments. (C) Time-lapse images of representative cells from (B), showing the timing of cell division. Scale bar = 20 µM. (D) HeLa cells were synchronized with thymidine, released and treated with RO at 6 h post-release. Samples were then harvested at the indicated times post-release, lysed, and analyzed by western blot with the indicated antibodies. Triangles indicate phosphorylated (black) and non-phosphorylated (white) forms of Greatwall (Gwl) and Cdc25C. All data shown are representative images from 3 independent experiments.
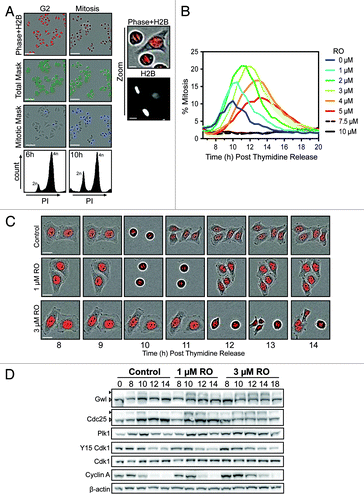
Figure 1. Effects of partial pre-mitotic Cdk1 inhibition. (A) Synchronized HeLa-H2B-mCherry cells were released from G1/S and treated at 6 h post-release (early G2 phase) with increasing doses of the Cdk1 inhibitor RO3306 (RO). Shown are characteristic fields of G2 and mitotic images captured, along with specific masks generated using the IncuCyte to count total cell number (green) and accurately identify mitotic cells (blue) based on differential H2B-mCherry intensity and shape. Scale bar = 200 µM (10 µM for zoom). (B) Data from (A) presented as a graph showing the percentage of mitotic cells at each time point. Images were taken every hour up to 20 h post-release from thymidine. Graph is representative of 3 independent experiments. (C) Time-lapse images of representative cells from (B), showing the timing of cell division. Scale bar = 20 µM. (D) HeLa cells were synchronized with thymidine, released and treated with RO at 6 h post-release. Samples were then harvested at the indicated times post-release, lysed, and analyzed by western blot with the indicated antibodies. Triangles indicate phosphorylated (black) and non-phosphorylated (white) forms of Greatwall (Gwl) and Cdc25C. All data shown are representative images from 3 independent experiments.

Figure 2. Exposure to increasing doses of RO leads to more severe mitotic defects and polyploidy. (A) Immunofluorescence of synchronized HeLa cells treated with indicated dose of RO at 6 h post-release from G1/S, and captured as they progressed through mitosis. Cells were counter-stained with β-tubulin (red) and DAPI (DNA, blue). Shown are the de-convolved maximum projections from 0.3 µm z-stacks. (B) Cells were treated as per (A), and stained for centrin (red), Plk1 (green) and DNA (blue). (C) Similar to (A), except cells were captured at 48 h post-release from thymidine. (D) DNA FACS analysis was performed on samples treated as per (A), with samples collected at 24, 48, and 72 h post-release. All data shown are representative images from 3 independent experiments. All scale bars = 5 µm.
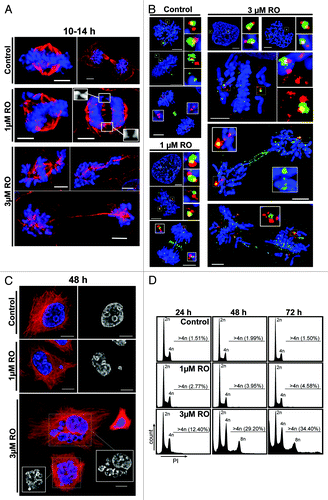
Figure 2. Exposure to increasing doses of RO leads to more severe mitotic defects and polyploidy. (A) Immunofluorescence of synchronized HeLa cells treated with indicated dose of RO at 6 h post-release from G1/S, and captured as they progressed through mitosis. Cells were counter-stained with β-tubulin (red) and DAPI (DNA, blue). Shown are the de-convolved maximum projections from 0.3 µm z-stacks. (B) Cells were treated as per (A), and stained for centrin (red), Plk1 (green) and DNA (blue). (C) Similar to (A), except cells were captured at 48 h post-release from thymidine. (D) DNA FACS analysis was performed on samples treated as per (A), with samples collected at 24, 48, and 72 h post-release. All data shown are representative images from 3 independent experiments. All scale bars = 5 µm.

Figure 3. Mild G2 inhibition of Cdk1 induces rapid mitotic exit whole chromosome segregation. (A) Immunofluorescence of synchronized HeLa cells treated with 3 µM or without (control) RO at 6 h post-release from G1/S. Cells were captured as they progressed through mitosis, and counter-stained with the kinetochore protein Mad2 (red) and DAPI (DNA, blue). Shown are the de-convolved maximum projections from 0.3 µm z-stacks, and the 3D surface renders of zoomed single chromosome (3 µM) and chromatid (control). All scale bars = 5 µm. (B) HeLa cells were synchronized with thymidine, released, and treated with RO at 6 h post-release. Samples were then harvested at the indicated times post-release, lysed, and analyzed by western blot with the indicated antibodies. All data shown are representative images from 3 independent experiments.
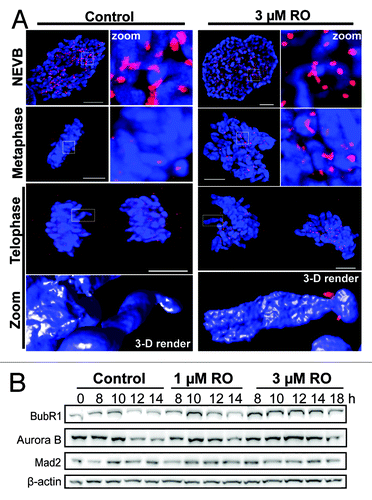
Figure 3. Mild G2 inhibition of Cdk1 induces rapid mitotic exit whole chromosome segregation. (A) Immunofluorescence of synchronized HeLa cells treated with 3 µM or without (control) RO at 6 h post-release from G1/S. Cells were captured as they progressed through mitosis, and counter-stained with the kinetochore protein Mad2 (red) and DAPI (DNA, blue). Shown are the de-convolved maximum projections from 0.3 µm z-stacks, and the 3D surface renders of zoomed single chromosome (3 µM) and chromatid (control). All scale bars = 5 µm. (B) HeLa cells were synchronized with thymidine, released, and treated with RO at 6 h post-release. Samples were then harvested at the indicated times post-release, lysed, and analyzed by western blot with the indicated antibodies. All data shown are representative images from 3 independent experiments.
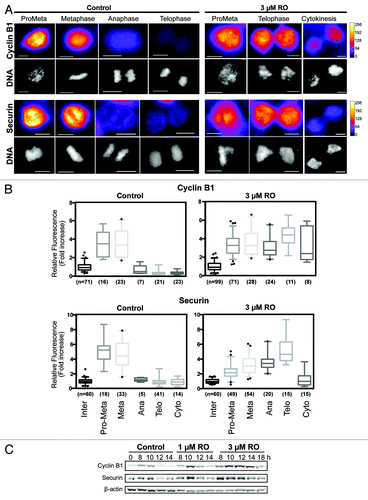
Figure 4. Cyclin B1 and securin are not degraded during decoupled mitotic exit. (A) Quantitative immunofluorescence was performed on HeLa cells treated as in and stained with DAPI (DNA, gray), and antibodies against cyclin B1 and securin. A Fire LUT was applied using ImageJ to the original raw unaltered images to clearly show the levels of staining for each protein. Scale bar = 10 µm. (B) The intensity of staining for each antibody (cyclin B1 and securin) was measured in each unaltered cell, normalized to interphase levels, expressed as fold increase and displayed as box-plots with 5 to 95% confidence intervals. The total number (n) of cells counted for each group is indicated. (C) HeLa cells were synchronized with thymidine, released, and treated with RO at 6 h post-release. Samples were then harvested at the indicated times post-release, lysed, and analyzed by western blot with the indicated antibodies. All data shown are representative images from 3 independent experiments.

Figure 4. Cyclin B1 and securin are not degraded during decoupled mitotic exit. (A) Quantitative immunofluorescence was performed on HeLa cells treated as in Figure 3A and stained with DAPI (DNA, gray), and antibodies against cyclin B1 and securin. A Fire LUT was applied using ImageJ to the original raw unaltered images to clearly show the levels of staining for each protein. Scale bar = 10 µm. (B) The intensity of staining for each antibody (cyclin B1 and securin) was measured in each unaltered cell, normalized to interphase levels, expressed as fold increase and displayed as box-plots with 5 to 95% confidence intervals. The total number (n) of cells counted for each group is indicated. (C) HeLa cells were synchronized with thymidine, released, and treated with RO at 6 h post-release. Samples were then harvested at the indicated times post-release, lysed, and analyzed by western blot with the indicated antibodies. All data shown are representative images from 3 independent experiments.

Figure 5. Partial Cdk1 inhibition prevents cells from reaching the substrate phosphorylation threshold require to correctly complete pro-metaphase. (A) Quantitative immunofluorescence was performed on HeLa cells treated as in , and stained with DAPI (DNA, gray), and an antibody against Cdk substrates phosphorylated on Ser (pSerCdk). A Fire LUT was applied using Fiji (ImageJ) to the original raw unaltered pSerCdk images to clearly show the levels of staining in each condition. (B) The intensity of staining for pSerCdk was measured in each unaltered cell, normalized to interphase levels, expressed as fold increase, and displayed as box plots with 5–95% confidence intervals. Dotted red and green lines indicate mean control levels of phosphorylation reached for pro-metaphase and NEVB respectively. The total number (n) of cells counted for each group is indicated. **P < 0.001 for 3 µM RO pro-metaphase (Pro-Meta) vs. control pro-metaphase. (C) HeLa cells were synchronized with thymidine, released, and treated with RO at 6 h post-release. Samples were then harvested at the indicated times post-release, lysed, and analyzed by western blot with the indicated antibodies. All data shown are representative images from 3 independent experiments. (D) Immunofluorescence of synchronized HeLa cells treated with 3 µM or without (control) RO at 6 h post-release from G1/S. Cells were captured as they progressed through mitosis, and counter-stained with Lamin A/C (red) and DAPI (DNA, blue). Shown are the de-convolved maximum projections from 0.3 µm z-stacks. All scale bars = 5 µm.
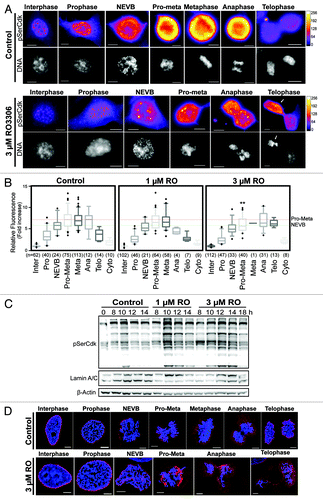
Figure 5. Partial Cdk1 inhibition prevents cells from reaching the substrate phosphorylation threshold require to correctly complete pro-metaphase. (A) Quantitative immunofluorescence was performed on HeLa cells treated as in Figure 3A, and stained with DAPI (DNA, gray), and an antibody against Cdk substrates phosphorylated on Ser (pSerCdk). A Fire LUT was applied using Fiji (ImageJ) to the original raw unaltered pSerCdk images to clearly show the levels of staining in each condition. (B) The intensity of staining for pSerCdk was measured in each unaltered cell, normalized to interphase levels, expressed as fold increase, and displayed as box plots with 5–95% confidence intervals. Dotted red and green lines indicate mean control levels of phosphorylation reached for pro-metaphase and NEVB respectively. The total number (n) of cells counted for each group is indicated. **P < 0.001 for 3 µM RO pro-metaphase (Pro-Meta) vs. control pro-metaphase. (C) HeLa cells were synchronized with thymidine, released, and treated with RO at 6 h post-release. Samples were then harvested at the indicated times post-release, lysed, and analyzed by western blot with the indicated antibodies. All data shown are representative images from 3 independent experiments. (D) Immunofluorescence of synchronized HeLa cells treated with 3 µM or without (control) RO at 6 h post-release from G1/S. Cells were captured as they progressed through mitosis, and counter-stained with Lamin A/C (red) and DAPI (DNA, blue). Shown are the de-convolved maximum projections from 0.3 µm z-stacks. All scale bars = 5 µm.

Figure 6. Mitotic decoupling induced by partial pre-mitotic inhibition of Cdk1 is rescued by Okadaic acid. (A) Similar to , except cells were treated with increasing doses of Okadaic acid (OA) instead of RO. (B) Time-lapse microscopy was performed on HeLa cells stably expressing EB3-GFP (green) and H2B-mCherry (red) that were synchronized by thymidine block and treated at 6 h post-release with or without Okadaic acid (OA 20 nM) and with increasing doses of the Cdk1 inhibitor RO (RO, 1 and 3 μM). Images were captured every 10 min. Notations indicate the time of the frame in minutes, lagging chromosomes (yellow arrows), metaphase plate orientation (dotted white lines), and cell death (yellow d). Scale bars = 5 µm. (C) Cells were split into 4 categories according to how they performed mitosis (normal, arrest, delay, exit) and expressed as a percentage for each condition. The total number (n) of cells counted for each group is indicated. (D) Individual cells from (B) were manually followed and scored for when they entered, and exited mitosis, as determined by the condensation and separation of chromosomes during prophase and anaphase, respectively. The time of mitotic entry and the mitotic length was then calculated and displayed as box plots, with 5 to 95% confidence intervals. The total number (n) of cells counted for each group is indicated *P < 0.01, **P < 0.001 ***P < 0.0001.
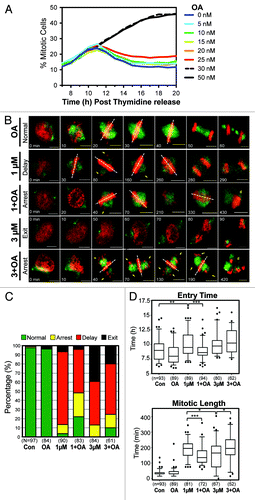
Figure 6. Mitotic decoupling induced by partial pre-mitotic inhibition of Cdk1 is rescued by Okadaic acid. (A) Similar to Figure 1, except cells were treated with increasing doses of Okadaic acid (OA) instead of RO. (B) Time-lapse microscopy was performed on HeLa cells stably expressing EB3-GFP (green) and H2B-mCherry (red) that were synchronized by thymidine block and treated at 6 h post-release with or without Okadaic acid (OA 20 nM) and with increasing doses of the Cdk1 inhibitor RO (RO, 1 and 3 μM). Images were captured every 10 min. Notations indicate the time of the frame in minutes, lagging chromosomes (yellow arrows), metaphase plate orientation (dotted white lines), and cell death (yellow d). Scale bars = 5 µm. (C) Cells were split into 4 categories according to how they performed mitosis (normal, arrest, delay, exit) and expressed as a percentage for each condition. The total number (n) of cells counted for each group is indicated. (D) Individual cells from (B) were manually followed and scored for when they entered, and exited mitosis, as determined by the condensation and separation of chromosomes during prophase and anaphase, respectively. The time of mitotic entry and the mitotic length was then calculated and displayed as box plots, with 5 to 95% confidence intervals. The total number (n) of cells counted for each group is indicated *P < 0.01, **P < 0.001 ***P < 0.0001.

Figure 7. Mechanisms of mitotic decoupling by low-dose Cdk1 inhibitor. A summary of the possible mechanism of how cytokinesis can be induced without separation of chromatids. Briefly, reduced Cdk1 activity during mitotic entry results in reduced phosphorylation of Cdk1 target substrates (such as ECT2 and PRC1). Without this negative phosphorylation, these substrates can bind Plk1 and initiate cytokinesis. However, during this period the large number of incorrectly attached kinetochores would provide a strong SAC signal to suppress APC mediated degradation of cyclin B1 and securin, thereby preventing segregation of chromatids and maintaining Cdk1 activity.
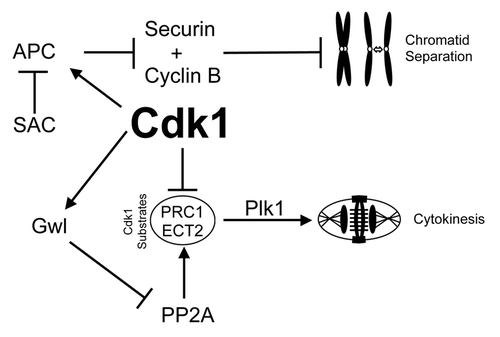
Figure 7. Mechanisms of mitotic decoupling by low-dose Cdk1 inhibitor. A summary of the possible mechanism of how cytokinesis can be induced without separation of chromatids. Briefly, reduced Cdk1 activity during mitotic entry results in reduced phosphorylation of Cdk1 target substrates (such as ECT2 and PRC1). Without this negative phosphorylation, these substrates can bind Plk1 and initiate cytokinesis. However, during this period the large number of incorrectly attached kinetochores would provide a strong SAC signal to suppress APC mediated degradation of cyclin B1 and securin, thereby preventing segregation of chromatids and maintaining Cdk1 activity.
Supplemental material

Additional material

Download Zip (5.1 MB)