2,740
Views
20
CrossRef citations to date
0
Altmetric
Report

Identification of two poorly prognosed ovarian carcinoma subtypes associated with CHEK2 germ-line mutation and non-CHEK2 somatic mutation gene signatures

, , &
Pages 2262-2280 | Received 03 Apr 2014, Accepted 17 May 2014, Published online: 30 May 2014

Figures & data

Figure 1. Statistical characteristics of gene mutations in HG-SOC. (A) Frequency distribution of mutations in susceptible driving genes. (B) Number of distinct mutations against number of mutated samples. Scatter plot of genes, where the vertical axis corresponds to the number of mutations across all samples and the horizontal axis corresponds to the number of samples with at least one mutation for a given gene. The diagonal represents the hypothetical scenario where number of mutations per sample for each gene is 1. Both axes are log10-transformed.
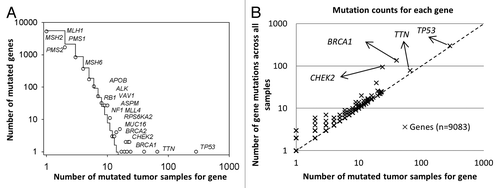
Figure 1. Statistical characteristics of gene mutations in HG-SOC. (A) Frequency distribution of mutations in susceptible driving genes. (B) Number of distinct mutations against number of mutated samples. Scatter plot of genes, where the vertical axis corresponds to the number of mutations across all samples and the horizontal axis corresponds to the number of samples with at least one mutation for a given gene. The diagonal represents the hypothetical scenario where number of mutations per sample for each gene is 1. Both axes are log10-transformed.

Figure 2. (A) Extracted sub-cluster of mutation matrix belonging to 58 genes and 22 patients, arranged via hierarchical clustering (Kendall–Tau distance, complete linkage). The intensity of the plot corresponds to the number of mutations (inclusive of silent mutations) observed for that gene and patient. (B) Direct interaction gene network of a subset of 21 genes identified from the mutation sub-cluster.
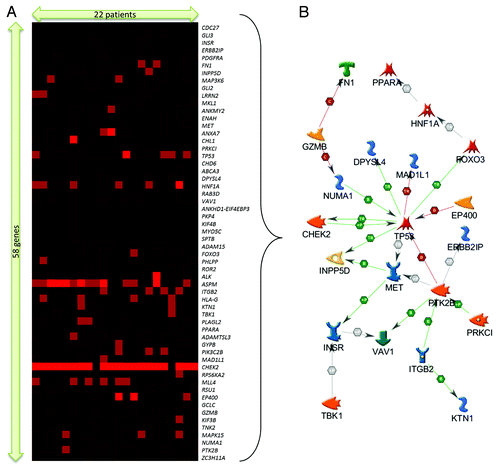
Figure 2. (A) Extracted sub-cluster of mutation matrix belonging to 58 genes and 22 patients, arranged via hierarchical clustering (Kendall–Tau distance, complete linkage). The intensity of the plot corresponds to the number of mutations (inclusive of silent mutations) observed for that gene and patient. (B) Direct interaction gene network of a subset of 21 genes identified from the mutation sub-cluster.

Figure 3. Kaplan–Meier survival curves of TCGA HG-SOC patients based on the non-silent mutational status of (A) CHEK2, (B) TP53, (C) BRCA1, and (D) MUC16.
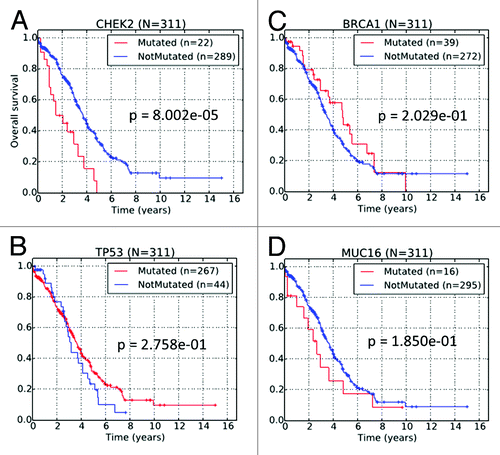
Figure 3. Kaplan–Meier survival curves of TCGA HG-SOC patients based on the non-silent mutational status of (A) CHEK2, (B) TP53, (C) BRCA1, and (D) MUC16.

Table 1. Kappa correlation of (A) CHEK2 mutations and (B) non-silent CHEK2 mutations with therapy resistance. Values in the contingency table represents the number of unique sample IDs corresponding to the row and column labels

Figure 4. (A) Locations of DNA mutations along genomic schema of the CHEK2 locus. The exon blocks are numbered sequentially from 5′ to 3′. Inverted triangles represent the locations of mutation on the exon. The numbers above the inverted triangles indicate the number of patients with the mutation (inclusive of synonymous mutations). (B) Locations of the expected mutations on the amino acid sequence. The alphabet in the inverted triangle indicates the reference amino acid residue, whereas the numbers of patients with non-synonymous mutations are shown above the inverted triangle. The numbers in the rectangular blocks indicate the amino acid residues span. (C) A representative crystal structure of the relaxed state of Chk2 protein after computational modeling and molecular dynamics simulation. All Chk2 mutations are represented by colored spheres, which indicate the locations of residues corresponding to the DNA mutations after translation. The CHEK2 isoform 1 (NM_007194/NP_009125/O96017) was used as the reference isoform. The forkhead-associated (FHA) domain, kinase domain and nuclear localization signal (NLS) are marked in pink, blue and cyan, respectively. The Venn diagram compares the number of patients with the observed mutation at 2 distinct nucleotide positions. Figures are not drawn to scale.
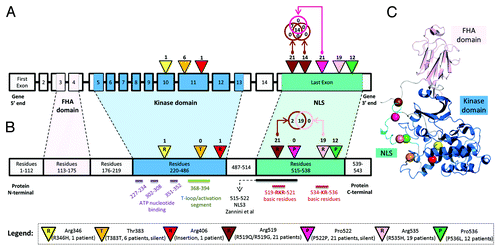
Figure 4. (A) Locations of DNA mutations along genomic schema of the CHEK2 locus. The exon blocks are numbered sequentially from 5′ to 3′. Inverted triangles represent the locations of mutation on the exon. The numbers above the inverted triangles indicate the number of patients with the mutation (inclusive of synonymous mutations). (B) Locations of the expected mutations on the amino acid sequence. The alphabet in the inverted triangle indicates the reference amino acid residue, whereas the numbers of patients with non-synonymous mutations are shown above the inverted triangle. The numbers in the rectangular blocks indicate the amino acid residues span. (C) A representative crystal structure of the relaxed state of Chk2 protein after computational modeling and molecular dynamics simulation. All Chk2 mutations are represented by colored spheres, which indicate the locations of residues corresponding to the DNA mutations after translation. The CHEK2 isoform 1 (NM_007194/NP_009125/O96017) was used as the reference isoform. The forkhead-associated (FHA) domain, kinase domain and nuclear localization signal (NLS) are marked in pink, blue and cyan, respectively. The Venn diagram compares the number of patients with the observed mutation at 2 distinct nucleotide positions. Figures are not drawn to scale.

Figure 5. Locations of CHEK2 mutations on the expected amino acid residues for various cancers and data sets. The CHEK2 isoform A (NM_007194) is used as the reference isoform. Red boxes indicate the location of mutations.

Figure 5. Locations of CHEK2 mutations on the expected amino acid residues for various cancers and data sets. The CHEK2 isoform A (NM_007194) is used as the reference isoform. Red boxes indicate the location of mutations.

Table 2. Prognostic significance of the 21 survival significant genes based on non-silent mutational status (Log-rank statistic P value ≤ 0.05, #mutated ≥ 5 and #non-mutated ≥ 5)

Figure 6. (A) Venn diagram of common genes between the identified gene mutation cluster and genes whose mutation status are prognostic significant. (B) Prognostic stratification based on mutational status of 21-gene signature. (C) Prognostic stratification based on the mutation of the CHEK2 gene and 20-gene signature.
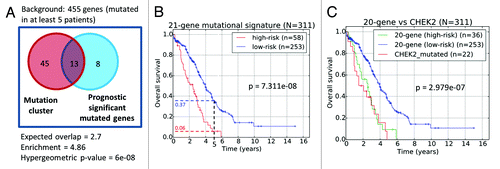
Figure 6. (A) Venn diagram of common genes between the identified gene mutation cluster and genes whose mutation status are prognostic significant. (B) Prognostic stratification based on mutational status of 21-gene signature. (C) Prognostic stratification based on the mutation of the CHEK2 gene and 20-gene signature.
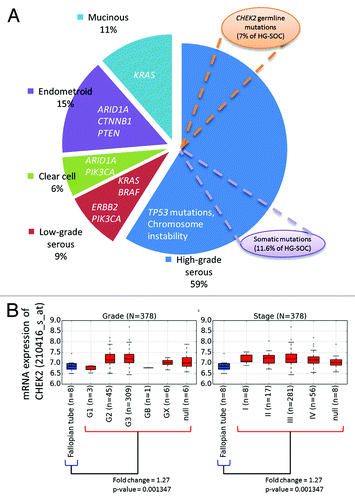
Table 3. Kappa correlation of patients classified by the 21 gene mutational signature with therapy resistance. Values in the contingency table represents the number of unique sample IDs corresponding to the row and column labels

Table 4. Genetic and clinical characteristics of CHEK2-MLL4-RPS6KA2 determined EOC tumor sub-class (G, germline; S, somatic; L, LOH)

Figure 7. (A) Key genes involved in etiology of various ovarian cancer subtypes. (B) Expression of CHEK2 mRNA across HG-SOC samples of various tumor grades and stages (denoted in red boxplots). Differential expression between the normal and tumor samples were calculated via Mann–Whitney test.

Figure 7. (A) Key genes involved in etiology of various ovarian cancer subtypes. (B) Expression of CHEK2 mRNA across HG-SOC samples of various tumor grades and stages (denoted in red boxplots). Differential expression between the normal and tumor samples were calculated via Mann–Whitney test.
Supplemental material

Additional material

Download Zip (5.5 MB)