1,840
Views
20
CrossRef citations to date
0
Altmetric
Report

Keap1 modulates the redox cycle and hepatocyte cell cycle in regenerating liver

, , , , &
Pages 2349-2358 | Received 12 Apr 2014, Accepted 20 May 2014, Published online: 28 May 2014

Figures & data

Figure 1. (A) Assessment of total proliferating hepatocytes. Wild-type (Keap1+/+) and Keap1 knockdown (Keap1+/−) mice were subjected to partial hepatectomy (PH) and sacrificed at the indicated time points. Ki-67 immunostaining was performed with liver sections. Ki67-positive hepatocytes were counted at 200x magnification in 5 randomly chosen fields per section. The results are shown as the means per field ± SD (n = 3–8 mice per genotype per time point). Asterisks represent P < 0.05 in comparison between Keap1+/+ and Keap1+/− mice. (B) Assessment of S-phase hepatocytes during the first round of hepatocyte cell cycle post-PH. One hour prior to sacrifice, BrdU was injected into the mice (100 mg/kg, i.p.). Liver sections were subjected to BrdU immunostaining. BrdU-positive hepatocytes were counted at 200x magnification in 5 randomly chosen fields per section. The data are shown as the means per field ± SD (n = 3–8 mice per genotype per time point). Asterisks represent P < 0.05 in comparison between Keap1+/+ and Keap1+/− mice. (C)Assessment of M-phase hepatocytes. After PH, mice were sacrificed at the indicated time points. Liver sections were stained with hematoxylin and eosin. Hepatocyte mitotic figures indicative of hepatocytes undergoing mitosis were counted at 100x magnification in 5 randomly chosen fields per liver section. The data are shown as the means per field ± SD (n = 3–8 mice per genotype per time point). Asterisks represent P < 0.05 in comparison between the time points indicated in each genotype group of mice.
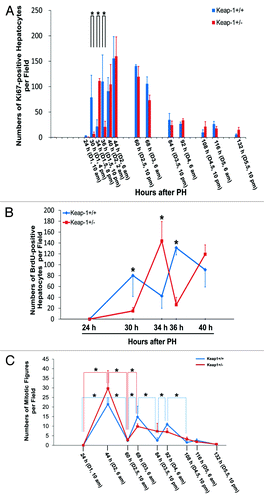
Figure 1. (A) Assessment of total proliferating hepatocytes. Wild-type (Keap1+/+) and Keap1 knockdown (Keap1+/−) mice were subjected to partial hepatectomy (PH) and sacrificed at the indicated time points. Ki-67 immunostaining was performed with liver sections. Ki67-positive hepatocytes were counted at 200x magnification in 5 randomly chosen fields per section. The results are shown as the means per field ± SD (n = 3–8 mice per genotype per time point). Asterisks represent P < 0.05 in comparison between Keap1+/+ and Keap1+/− mice. (B) Assessment of S-phase hepatocytes during the first round of hepatocyte cell cycle post-PH. One hour prior to sacrifice, BrdU was injected into the mice (100 mg/kg, i.p.). Liver sections were subjected to BrdU immunostaining. BrdU-positive hepatocytes were counted at 200x magnification in 5 randomly chosen fields per section. The data are shown as the means per field ± SD (n = 3–8 mice per genotype per time point). Asterisks represent P < 0.05 in comparison between Keap1+/+ and Keap1+/− mice. (C)Assessment of M-phase hepatocytes. After PH, mice were sacrificed at the indicated time points. Liver sections were stained with hematoxylin and eosin. Hepatocyte mitotic figures indicative of hepatocytes undergoing mitosis were counted at 100x magnification in 5 randomly chosen fields per liver section. The data are shown as the means per field ± SD (n = 3–8 mice per genotype per time point). Asterisks represent P < 0.05 in comparison between the time points indicated in each genotype group of mice.

Figure 2. (A) Hepatic expression of Keap1 protein during the first wave of hepatocyte proliferation after partial hepatectomy (PH) in Keap1+/+ and Keap1+/− mice. Total liver lysates were prepared from the livers collected at the indicated time points after PH. Western blotting was performed with an antibody against Keap1 protein. Glyceraldehyde 3-phosphate dehydrogenase (GADPH) was used as a loading control. A representative blot of 3 independent experiments is shown. NL, normal liver. (B) Hepatic mRNA expression of Nrf2, NQO1, GPX2, GSTmu3, and Klf9 during the first wave of hepatocyte proliferation after PH in Keap1+/+ and Keap1+/− mice. Total RNA was prepared from liver tissues collected prior to or after PH at the indicated time points. Hepatic mRNA levels for the genes indicated were measured by qRT-PCR and are expressed as the mean fold changes compared with wild-type normal controls ± SD (n = 3 mice per time point per genotype). Asterisks represent P < 0.05 in comparison between Keap1+/+ and Keap1+/− mice.
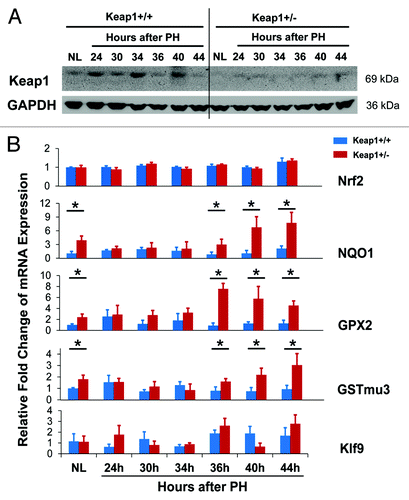
Figure 2. (A) Hepatic expression of Keap1 protein during the first wave of hepatocyte proliferation after partial hepatectomy (PH) in Keap1+/+ and Keap1+/− mice. Total liver lysates were prepared from the livers collected at the indicated time points after PH. Western blotting was performed with an antibody against Keap1 protein. Glyceraldehyde 3-phosphate dehydrogenase (GADPH) was used as a loading control. A representative blot of 3 independent experiments is shown. NL, normal liver. (B) Hepatic mRNA expression of Nrf2, NQO1, GPX2, GSTmu3, and Klf9 during the first wave of hepatocyte proliferation after PH in Keap1+/+ and Keap1+/− mice. Total RNA was prepared from liver tissues collected prior to or after PH at the indicated time points. Hepatic mRNA levels for the genes indicated were measured by qRT-PCR and are expressed as the mean fold changes compared with wild-type normal controls ± SD (n = 3 mice per time point per genotype). Asterisks represent P < 0.05 in comparison between Keap1+/+ and Keap1+/− mice.

Figure 3. Protein expression of a subset of cell cycle components in regenerating livers of Keap1+/+ and Keap1+/− mice. Livers were collected from normal mice and the mice subjected to partial hepatectomy (PH) at the indicated time points after surgery. Western blotting was performed using liver lysates pooled from 3 mice per time point per genotype with antibodies against the proteins indicated. Glyceraldehyde 3-phosphate dehydrogenase (GADPH) was used as a loading control. NL, normal liver.
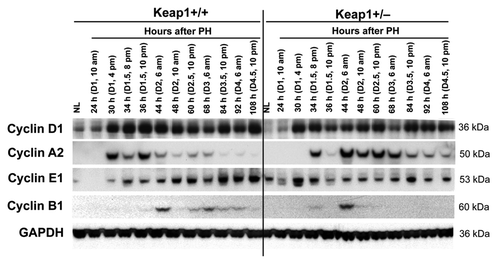
Figure 3. Protein expression of a subset of cell cycle components in regenerating livers of Keap1+/+ and Keap1+/− mice. Livers were collected from normal mice and the mice subjected to partial hepatectomy (PH) at the indicated time points after surgery. Western blotting was performed using liver lysates pooled from 3 mice per time point per genotype with antibodies against the proteins indicated. Glyceraldehyde 3-phosphate dehydrogenase (GADPH) was used as a loading control. NL, normal liver.

Figure 4. Protein expression of a subset of mitogenic signaling molecules in regenerating livers of Keap1+/+ and Keap1+/− mice. Liver lysates were prepared as described in . Western blotting was performed with antibodies against the proteins indicated. GADPH was used as a loading control. Blue and red boxes indicate the similar phosphorylation patterns of p-Akt1 (T308) and p-p70S6K (T389) in Keap1+/+ and Keap1+/− regenerating livers, respectively.
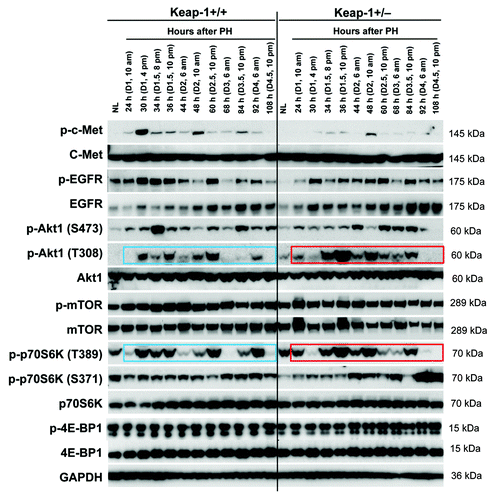
Figure 4. Protein expression of a subset of mitogenic signaling molecules in regenerating livers of Keap1+/+ and Keap1+/− mice. Liver lysates were prepared as described in Figure 3. Western blotting was performed with antibodies against the proteins indicated. GADPH was used as a loading control. Blue and red boxes indicate the similar phosphorylation patterns of p-Akt1 (T308) and p-p70S6K (T389) in Keap1+/+ and Keap1+/− regenerating livers, respectively.

Figure 5. Hepatic redox states during the first wave of hepatocyte proliferation after partial hepatectomy (PH) in Keap1+/+ and Keap1+/− mice. (A) Liver cryosections prepared from 3 mice per time point per genotype were stained with dihydroethidium (DHE). The DHE was oxidized by hepatic free radicals, which generated 2-hydroxyethidium and ethidium. Ethidium-stained DNA exhibited red fluorescence. Representative photographs of liver sections (400×) were taken using the same contrast and lightness parameters and are shown. (B) Hepatic malondialdehyde (MDA) equivalents were quantified to monitor lipid peroxidation indicative of oxidative stress using a thiobarbituric acid reactive substances (TBARS) assay kit. The data are shown as the means of MDA equivalents (nmol/mg liver) ± SD (n = 3 mice/time point/genotype). Asterisks represent P < 0.05 in comparison between Keap1+/+ and Keap1+/− mice. NL, normal liver.
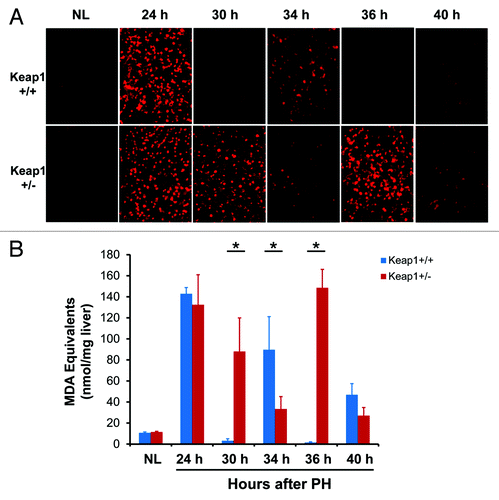
Figure 5. Hepatic redox states during the first wave of hepatocyte proliferation after partial hepatectomy (PH) in Keap1+/+ and Keap1+/− mice. (A) Liver cryosections prepared from 3 mice per time point per genotype were stained with dihydroethidium (DHE). The DHE was oxidized by hepatic free radicals, which generated 2-hydroxyethidium and ethidium. Ethidium-stained DNA exhibited red fluorescence. Representative photographs of liver sections (400×) were taken using the same contrast and lightness parameters and are shown. (B) Hepatic malondialdehyde (MDA) equivalents were quantified to monitor lipid peroxidation indicative of oxidative stress using a thiobarbituric acid reactive substances (TBARS) assay kit. The data are shown as the means of MDA equivalents (nmol/mg liver) ± SD (n = 3 mice/time point/genotype). Asterisks represent P < 0.05 in comparison between Keap1+/+ and Keap1+/− mice. NL, normal liver.

Figure 6. DNA damage assessments and DNA damage repair gene expression during the first wave of hepatocyte proliferation after partial hepatectomy (PH) in Keap1+/+ and Keap1+/− mice. (A) Immunohistochemistry was performed using the γ-H2A.X antibody with liver sections prepared from regenerating livers at the indicated time points after PH. DyLight 488-conjugated AffiniPure Goat Anti-Mouse IgG was used as a secondary antibody. γ-H2A.X+ foci in hepatocyte nuclei exhibit green fluorescence. Representative nuclei with 4 or more γ-H2A.X+ foci are indicated by arrows. (B) The nuclei with more than 4 γ-H2A.X+ foci were counted in 5 randomly chosen microscope fields (200x) per section. The data are shown as the means per field ± SD (n = 3 mice/time point/genotype). Asterisks represent P < 0.05 in comparison between Keap1+/+ and Keap1+/− mice. (C) Total RNA was prepared from liver tissues collected prior to or after PH at the indicated time points. Hepatic mRNA levels of RAD51 and RAD51l1 were quantified by qRT-PCR and are expressed as the mean fold changes compared with wild-type normal controls ± SD (n = 3 mice per time point per genotype). Asterisks represent P < 0.05 in comparison between Keap1+/+ and Keap1+/− mice.
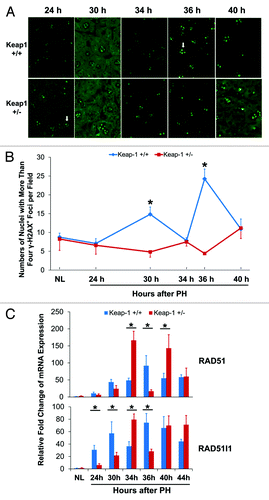
Figure 6. DNA damage assessments and DNA damage repair gene expression during the first wave of hepatocyte proliferation after partial hepatectomy (PH) in Keap1+/+ and Keap1+/− mice. (A) Immunohistochemistry was performed using the γ-H2A.X antibody with liver sections prepared from regenerating livers at the indicated time points after PH. DyLight 488-conjugated AffiniPure Goat Anti-Mouse IgG was used as a secondary antibody. γ-H2A.X+ foci in hepatocyte nuclei exhibit green fluorescence. Representative nuclei with 4 or more γ-H2A.X+ foci are indicated by arrows. (B) The nuclei with more than 4 γ-H2A.X+ foci were counted in 5 randomly chosen microscope fields (200x) per section. The data are shown as the means per field ± SD (n = 3 mice/time point/genotype). Asterisks represent P < 0.05 in comparison between Keap1+/+ and Keap1+/− mice. (C) Total RNA was prepared from liver tissues collected prior to or after PH at the indicated time points. Hepatic mRNA levels of RAD51 and RAD51l1 were quantified by qRT-PCR and are expressed as the mean fold changes compared with wild-type normal controls ± SD (n = 3 mice per time point per genotype). Asterisks represent P < 0.05 in comparison between Keap1+/+ and Keap1+/− mice.

Figure 7. A hypothesis for Keap1-mediated hepatic redox cycle and hepatocyte cell cycle in regenerating livers. Redox sensor Keap1 modulates the cycle of free radicals produced by regenerating livers by both Nrf2-depedent and -independent mechanisms. Keap1 also regulates the activities of hepatocyte mitogenic signaling molecules, including c-Met, EGFR, Akt1, and p70S6K, and their downstream effectors, including Cyclins A2 and B1. Nrf2 needs to be kept quiescent when hepatocytes are replicating. The threshold of Keap1 expression is tightly controlled to ensure the proper coupling of hepatic redox cycle and hepatocyte cell cycle, thereby enabling hepatocytes to enter and progress through the cell cycle smoothly and rhythmically during liver regeneration.
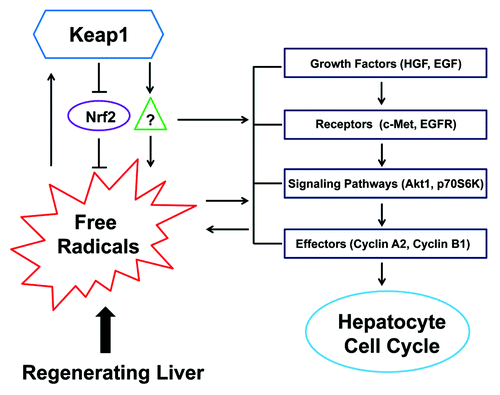
Figure 7. A hypothesis for Keap1-mediated hepatic redox cycle and hepatocyte cell cycle in regenerating livers. Redox sensor Keap1 modulates the cycle of free radicals produced by regenerating livers by both Nrf2-depedent and -independent mechanisms. Keap1 also regulates the activities of hepatocyte mitogenic signaling molecules, including c-Met, EGFR, Akt1, and p70S6K, and their downstream effectors, including Cyclins A2 and B1. Nrf2 needs to be kept quiescent when hepatocytes are replicating. The threshold of Keap1 expression is tightly controlled to ensure the proper coupling of hepatic redox cycle and hepatocyte cell cycle, thereby enabling hepatocytes to enter and progress through the cell cycle smoothly and rhythmically during liver regeneration.
Supplemental material

Additional material

Download Zip (4.9 MB)

Reprints and Corporate Permissions

Please note: Selecting permissions does not provide access to the full text of the article, please see our help page How do I view content?

To request a reprint or corporate permissions for this article, please click on the relevant link below:

Academic Permissions

Please note: Selecting permissions does not provide access to the full text of the article, please see our help page How do I view content?

Obtain permissions instantly via Rightslink by clicking on the button below:

If you are unable to obtain permissions via Rightslink, please complete and submit this Permissions form. For more information, please visit our Permissions help page.