453
Views
7
CrossRef citations to date
0
Altmetric
Report

Disruption of calvarial ossification in E2f4 mutant embryos correlates with increased proliferation and progenitor cell populations

, , &
Pages 2620-2628 | Published online: 01 Jul 2010

Figures & data

Figure 1 Mutation of E2f4 causes defects in embryonic bone ossification. (A–C) Alizarin Red (bone) and Alcian Blue (cartilage) staining of representative e18.5 and P0 littermate embryos. At e18.5 E2f4-/- embryos exhibit less ossification in (A) the sternebrae (arrows) and xiphoid process, (B) presphenoid bone and (C) cranium (n ≥ 6). By P0 the extent of ossification is similar between wild-type and E2f4-/- animals (n ≥ 4). Abbreviations: xp, xiphoid process; pp, palatine process; ps, presphenoid (with arrow); fr, frontal bone; pa, parietal bone.
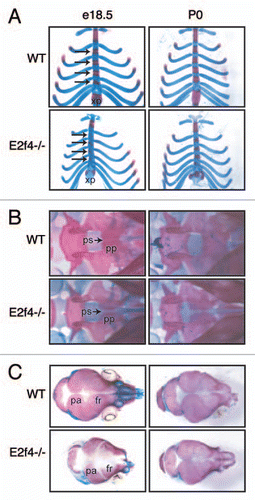
Figure 1 Mutation of E2f4 causes defects in embryonic bone ossification. (A–C) Alizarin Red (bone) and Alcian Blue (cartilage) staining of representative e18.5 and P0 littermate embryos. At e18.5 E2f4-/- embryos exhibit less ossification in (A) the sternebrae (arrows) and xiphoid process, (B) presphenoid bone and (C) cranium (n ≥ 6). By P0 the extent of ossification is similar between wild-type and E2f4-/- animals (n ≥ 4). Abbreviations: xp, xiphoid process; pp, palatine process; ps, presphenoid (with arrow); fr, frontal bone; pa, parietal bone.

Figure 2 Mutation of E2f4 causes defects in early embryonic cartilage and bone development. Alizarin Red (bone) and Alcian Blue (cartilage) staining of (A) e13.5 and (B) e15.5 embryos. e13.5 E2f4-/- embryos exhibit less ossification in the clavicles, n ≥ 2 (arrowheads). e15.5 E2f4-/- embryos display less ossification of bone (arrowhead) and less deposition of cartilage matrix in the presphenoid and basisphenoid elements, located below the cranial vault, n ≥ 4. Abbreviations: bs, basisphenoid; ps, presphenoid.
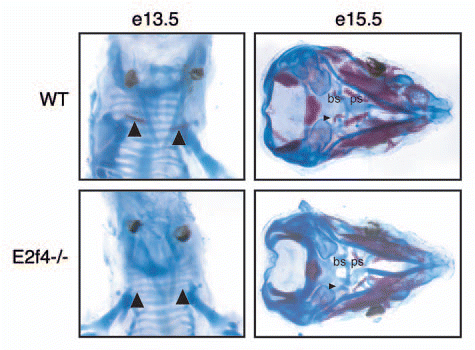
Figure 2 Mutation of E2f4 causes defects in early embryonic cartilage and bone development. Alizarin Red (bone) and Alcian Blue (cartilage) staining of (A) e13.5 and (B) e15.5 embryos. e13.5 E2f4-/- embryos exhibit less ossification in the clavicles, n ≥ 2 (arrowheads). e15.5 E2f4-/- embryos display less ossification of bone (arrowhead) and less deposition of cartilage matrix in the presphenoid and basisphenoid elements, located below the cranial vault, n ≥ 4. Abbreviations: bs, basisphenoid; ps, presphenoid.

Figure 3 E2f4-deficient frontal bones display decreased levels of ossification and increased levels of proliferating cells. (A) Coronal sections of frontal bones from e17.5 embryos were assessed by histochemical analysis of alkaline phosphatase activity (ALP) or Alizarin Red staining of bone (AR). E2f4-/- frontal bone sections exhibit a slightly decreased extent of ALP and significantly decreased extent and intensity of AR staining in comparison with wildtype embryos (n ≥ 8). 2X magnification shown. Arrows indicate the front of activity or staining, respectively. (B) Immunohistochemical analysis of BrdU incorporation (n ≥ 5) or Ki67 protein expression (n ≥ 3) in coronal sections of frontal bones from e17.5 embryos. The frontal bones (delimited by the bracket) exhibit a greater percentage of nuclei positively staining for both BrdU and Ki67 in E2f4-/- embryos in comparison with wildtype frontal bones. 20X magnification shown. Compiled results from all experiments are quantified below the images; error bars indicate 1 SD, *p < 0.05. Abbreviations: de, dermis; fr, frontal bone; br, brain.
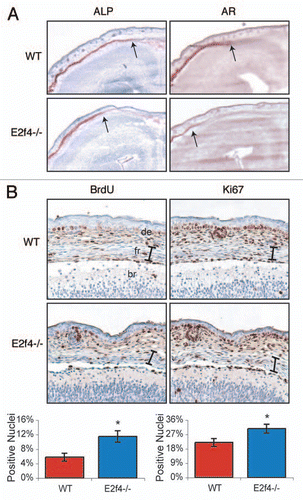
Figure 3 E2f4-deficient frontal bones display decreased levels of ossification and increased levels of proliferating cells. (A) Coronal sections of frontal bones from e17.5 embryos were assessed by histochemical analysis of alkaline phosphatase activity (ALP) or Alizarin Red staining of bone (AR). E2f4-/- frontal bone sections exhibit a slightly decreased extent of ALP and significantly decreased extent and intensity of AR staining in comparison with wildtype embryos (n ≥ 8). 2X magnification shown. Arrows indicate the front of activity or staining, respectively. (B) Immunohistochemical analysis of BrdU incorporation (n ≥ 5) or Ki67 protein expression (n ≥ 3) in coronal sections of frontal bones from e17.5 embryos. The frontal bones (delimited by the bracket) exhibit a greater percentage of nuclei positively staining for both BrdU and Ki67 in E2f4-/- embryos in comparison with wildtype frontal bones. 20X magnification shown. Compiled results from all experiments are quantified below the images; error bars indicate 1 SD, *p < 0.05. Abbreviations: de, dermis; fr, frontal bone; br, brain.

Figure 4 E2f4-/- calvarial cell populations generate more calcified matrix than wildtype calvarial cell populations, but do not display altered proliferation or cell cycle exit phenotypes. (A) ossification of primary calvarial cells was determined by Alizarin Red staining of secreted calcium deposits after 0 and 35 days of induction. E2f4-/- calvarial cells secrete a greater amount of calcium deposits than wildtype osteoblasts (n ≥ 8). (B) Quantitative RT-PCR measurements of bone marker mRNA levels from wildtype (red bars) and E2f4-/- (blue bars) calvarial cells during induction. E2f4-/- calvarial cells express higher levels of Osterix, Osteopontin and, at times, Alkaline Phosphatase mRNAs compared to wildtype cells. Ubiquitin was used as an internal control to normalize for RNA levels within each sample. Each time point is an average of three replicates. Columns, results from a representative littermate pair; error bars represent 1 SD, a representative experiment is shown (n ≥ 3). (C) Indirect immunofluorescence analysis of proliferation in calvarial cells. Wildtype and E2f4-/- calvarial cells were cultured with BrdU for 24 hours at the indicated time points during induction in vitro. DNA within nuclei is stained with DAPI (blue) and incorporated BrdU labeled by indirect immunofluorescence (green). 20X magnification shown. (D) Quantitation of proliferation, a minimum of 250 cells was analyzed per sample from four separate experiments and the percentage of BrdU positive cells calculated in each case and averaged; error bars indicate 1 SD. Wildtype (red bars) and E2f4-/- (blue bars) calvarial cell cultures display similar percentages of BrdU positive cells indicating similar levels of proliferation and cell cycle exit during the induction time course.
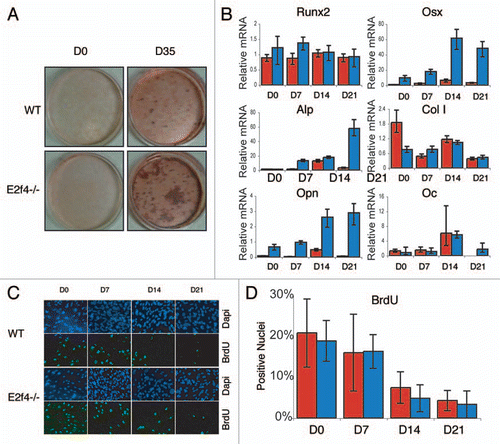
Figure 4 E2f4-/- calvarial cell populations generate more calcified matrix than wildtype calvarial cell populations, but do not display altered proliferation or cell cycle exit phenotypes. (A) ossification of primary calvarial cells was determined by Alizarin Red staining of secreted calcium deposits after 0 and 35 days of induction. E2f4-/- calvarial cells secrete a greater amount of calcium deposits than wildtype osteoblasts (n ≥ 8). (B) Quantitative RT-PCR measurements of bone marker mRNA levels from wildtype (red bars) and E2f4-/- (blue bars) calvarial cells during induction. E2f4-/- calvarial cells express higher levels of Osterix, Osteopontin and, at times, Alkaline Phosphatase mRNAs compared to wildtype cells. Ubiquitin was used as an internal control to normalize for RNA levels within each sample. Each time point is an average of three replicates. Columns, results from a representative littermate pair; error bars represent 1 SD, a representative experiment is shown (n ≥ 3). (C) Indirect immunofluorescence analysis of proliferation in calvarial cells. Wildtype and E2f4-/- calvarial cells were cultured with BrdU for 24 hours at the indicated time points during induction in vitro. DNA within nuclei is stained with DAPI (blue) and incorporated BrdU labeled by indirect immunofluorescence (green). 20X magnification shown. (D) Quantitation of proliferation, a minimum of 250 cells was analyzed per sample from four separate experiments and the percentage of BrdU positive cells calculated in each case and averaged; error bars indicate 1 SD. Wildtype (red bars) and E2f4-/- (blue bars) calvarial cell cultures display similar percentages of BrdU positive cells indicating similar levels of proliferation and cell cycle exit during the induction time course.

Figure 5 E2F4 does not modulate the induction of calcified matrix in vitro. E2f4-/- calvarial cells were stably infected with hE2F4 or an empty virus and induced to undergo bone deposition. (A) Alizarin Red staining was conducted after 0 and 35 days. No significant difference in the amount of Alizarin red staining is observed between E2f4-/- cells overexpressing hE2F4 or E2f4-/- control cells (n ≥ 6). (B) hE2F4 protein expression is maintained throughout the 35 day duration of a differentiation time course experiment as judged by western blotting. Gapdh levels in the same samples are shown as a loading control. (C) Quantitative RT-PCR (performed as described in ) showed no consistant difference in the expression of osteoblast markers between control cells (red bars) and cells overexpressing E2F4 (blue bars). Wildtype calvarial cells were stably infected with a hairpin against E2f4 or luciferase and induced to generate bone matrix. (D) Alizarin Red staining of secreted bone calcium deposits was conducted after 0 and 35 days. No difference is observed between wildtype cells expressing a hairpin directed against E2f4 in comparison with those expressing the luciferase control hairpin (n ≥ 6). (e) Stable infection of the E2f4 hairpin significantly reduces the level of E2F4 protein through the 35-day duration of the experiment as judged by western blotting. Gapdh levels in the same samples are shown as a loading control. (F) Quantitative RT-PCR showed no consistent in the expression of osteoblast markers between control cells (red bars) and cells with knock down of E2F4 (blue bars).
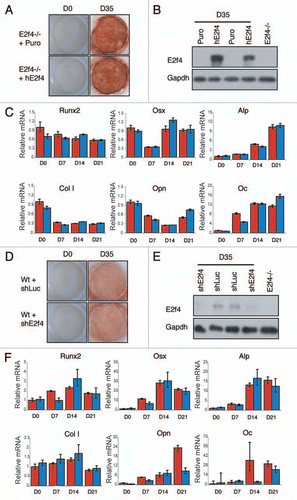
Figure 5 E2F4 does not modulate the induction of calcified matrix in vitro. E2f4-/- calvarial cells were stably infected with hE2F4 or an empty virus and induced to undergo bone deposition. (A) Alizarin Red staining was conducted after 0 and 35 days. No significant difference in the amount of Alizarin red staining is observed between E2f4-/- cells overexpressing hE2F4 or E2f4-/- control cells (n ≥ 6). (B) hE2F4 protein expression is maintained throughout the 35 day duration of a differentiation time course experiment as judged by western blotting. Gapdh levels in the same samples are shown as a loading control. (C) Quantitative RT-PCR (performed as described in Fig. 3B) showed no consistant difference in the expression of osteoblast markers between control cells (red bars) and cells overexpressing E2F4 (blue bars). Wildtype calvarial cells were stably infected with a hairpin against E2f4 or luciferase and induced to generate bone matrix. (D) Alizarin Red staining of secreted bone calcium deposits was conducted after 0 and 35 days. No difference is observed between wildtype cells expressing a hairpin directed against E2f4 in comparison with those expressing the luciferase control hairpin (n ≥ 6). (e) Stable infection of the E2f4 hairpin significantly reduces the level of E2F4 protein through the 35-day duration of the experiment as judged by western blotting. Gapdh levels in the same samples are shown as a loading control. (F) Quantitative RT-PCR showed no consistent in the expression of osteoblast markers between control cells (red bars) and cells with knock down of E2F4 (blue bars).

Figure 6 E2f4-/- calvarial preparations contain more ALp-progenitor osteoblasts than wildtype preparations. (A) Alkaline phosphatase (ALP) staining of calvarial cells. Cells isolated from calvaria were sparsely plated in induction media and stained for ALP activity at the indicated time points. E2f4-/- embryo derived calvarial cells produce more alkaline phosphatase-positive colonies, likely derived from osteoblast progenitors, than wildtype embryo derived cells (n ≥ 5). (B) Limiting dilution assay of wildtype and E2f4-/- calvarial cells. Cells were plated directly into induction media and alkaline-phosphatase-positive colony number was assessed 7 days later. The graph shows an average of 9 independent experiments, error bars indicate one standard deviation. E2f4-/- calvarial cultures exhibited a higher clonal frequency of alkaline phosphatase-positive colonies in comparison with wildtype derived cultures.
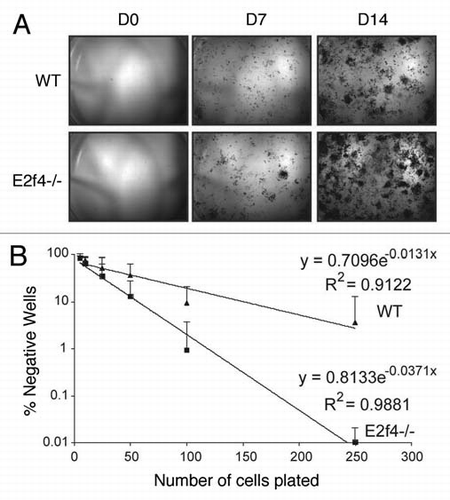
Figure 6 E2f4-/- calvarial preparations contain more ALp-progenitor osteoblasts than wildtype preparations. (A) Alkaline phosphatase (ALP) staining of calvarial cells. Cells isolated from calvaria were sparsely plated in induction media and stained for ALP activity at the indicated time points. E2f4-/- embryo derived calvarial cells produce more alkaline phosphatase-positive colonies, likely derived from osteoblast progenitors, than wildtype embryo derived cells (n ≥ 5). (B) Limiting dilution assay of wildtype and E2f4-/- calvarial cells. Cells were plated directly into induction media and alkaline-phosphatase-positive colony number was assessed 7 days later. The graph shows an average of 9 independent experiments, error bars indicate one standard deviation. E2f4-/- calvarial cultures exhibited a higher clonal frequency of alkaline phosphatase-positive colonies in comparison with wildtype derived cultures.

Table 1 Quantitative RT-PCR primer pairs

Reprints and Corporate Permissions

Please note: Selecting permissions does not provide access to the full text of the article, please see our help page How do I view content?

To request a reprint or corporate permissions for this article, please click on the relevant link below:

Academic Permissions

Please note: Selecting permissions does not provide access to the full text of the article, please see our help page How do I view content?

Obtain permissions instantly via Rightslink by clicking on the button below:

If you are unable to obtain permissions via Rightslink, please complete and submit this Permissions form. For more information, please visit our Permissions help page.