648
Views
9
CrossRef citations to date
0
Altmetric
Report

HdmX overexpression inhibits oncogene induced cellular senescence

, , &
Pages 3396-3402 | Published online: 15 Aug 2010

Figures & data

Figure 1 p53- and -Hdm2 binding domains of HdmX are essential for blocking oncogenic Ras induced premature senescence. IMR90 cells were transduced at an MOI of 5 with the indicated lentivirus: (1) mock infection (Mock), (2) H-Ras (Ras), (3) GFP, (4) Ras + GFP, (5) Ras + HdmX, (6) Ras + Hdm2, (7) Ras + HdmXG57A (XG57A) or (8) Ras + HdmXC437G (XC437G), followed by incubation in complete media for 7 days at which time β-galactosidase staining was completed. (A) Histogram represents average ± SeM of % beta-galactosidase positive cells normalized to transduction efficiency (based on GFP). over 100 cells were counted per treatment and each infection was repeated in biological triplicate. (B) Representative images for infections as described in (A) are shown. Bright-field or fluorescence images were taken at same exposure time and 100X magnification. (C) Western blot demonstrating expression of the indicated proteins.
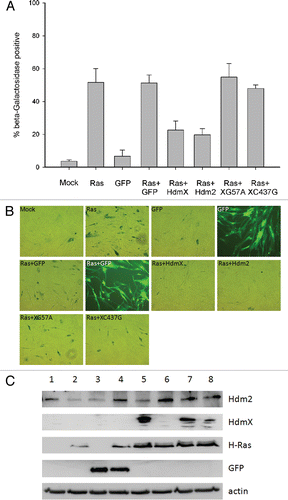
Figure 1 p53- and -Hdm2 binding domains of HdmX are essential for blocking oncogenic Ras induced premature senescence. IMR90 cells were transduced at an MOI of 5 with the indicated lentivirus: (1) mock infection (Mock), (2) H-Ras (Ras), (3) GFP, (4) Ras + GFP, (5) Ras + HdmX, (6) Ras + Hdm2, (7) Ras + HdmXG57A (XG57A) or (8) Ras + HdmXC437G (XC437G), followed by incubation in complete media for 7 days at which time β-galactosidase staining was completed. (A) Histogram represents average ± SeM of % beta-galactosidase positive cells normalized to transduction efficiency (based on GFP). over 100 cells were counted per treatment and each infection was repeated in biological triplicate. (B) Representative images for infections as described in (A) are shown. Bright-field or fluorescence images were taken at same exposure time and 100X magnification. (C) Western blot demonstrating expression of the indicated proteins.

Figure 2 HdmX nuclear localization is dependent on association with Hdm2. IMR90 cells were transduced with lentivirus expressing wild-type HdmX, HdmXC437G or HdmXG57A in addition to GFP (left) or Hdm2 (right). Cells were selected and then nuclear and cytoplasmic protein extracts separated on an SDS-PAGE gel. Localization of Lamin A/C (a nuclear protein) and Tubulin (a cytoplasmic protein) confirm the extract fractionation was effective.

Figure 2 HdmX nuclear localization is dependent on association with Hdm2. IMR90 cells were transduced with lentivirus expressing wild-type HdmX, HdmXC437G or HdmXG57A in addition to GFP (left) or Hdm2 (right). Cells were selected and then nuclear and cytoplasmic protein extracts separated on an SDS-PAGE gel. Localization of Lamin A/C (a nuclear protein) and Tubulin (a cytoplasmic protein) confirm the extract fractionation was effective.

Figure 3 Loss of HdmX induces senescence in LNCaps. (A) LNCap cells were transduced with no virus (Mock), GFP, shLacZ (shL), HdmX, HdmX-Rescue (X/R), shHdmX (shX), shL + X/R, shX + X/R or shX + GFp, selected for 7 days and subjected to western blotting using the indicated antibodies. (B) Average % β-galactosidase positive cells normalized to transduction efficiency (based on GFP) ±SEM is reported where >100 cells were counted per treatment (same as in A) in three biological replicates, except Mock, which is in duplicate.

Figure 3 Loss of HdmX induces senescence in LNCaps. (A) LNCap cells were transduced with no virus (Mock), GFP, shLacZ (shL), HdmX, HdmX-Rescue (X/R), shHdmX (shX), shL + X/R, shX + X/R or shX + GFp, selected for 7 days and subjected to western blotting using the indicated antibodies. (B) Average % β-galactosidase positive cells normalized to transduction efficiency (based on GFP) ±SEM is reported where >100 cells were counted per treatment (same as in A) in three biological replicates, except Mock, which is in duplicate.

Figure 4 HdmX knockdown induces beta-galactosidase activity in LNCaps that cannot be reversed by HdmX overexpression post-senescence. LNCaps were transduced with no virus (Mock), GFP, shLacZ (shL), HdmX-Rescue (X/R), shL + X/R, shHdmX (shX) + X/R, shL, shX or shX and selection applied for 7 days. At day 7, shL infected cells were additionally infected with X/R (shL: X/R), shX infected cells with X/R (shX: X/R) and shX infected cells with GFP (shX: GFP). Cells were selected and incubated for an additional 7 days before β-galactosidase staining. (A) Average % beta-galactosidase positive cells normalized to transduction efficiency (based on GFP) ±SEM is reported where >100 cells were counted per treatment in biological triplicate. (B) Representative images of each treatment condition. All images taken at 100X magnification and the same exposure time for brightfield or fluorescence images. (C) Western blot confirming HdmX knock-down and rescue in additional treatment conditions not present in . (D) Rt-PCR demonstrating relative expression of PAI-1 normalized to GAPDH in shLacZ or shHdmX infected LNCaP cells at day 14. Bars represent 95% confidence intervals.

Figure 4 HdmX knockdown induces beta-galactosidase activity in LNCaps that cannot be reversed by HdmX overexpression post-senescence. LNCaps were transduced with no virus (Mock), GFP, shLacZ (shL), HdmX-Rescue (X/R), shL + X/R, shHdmX (shX) + X/R, shL, shX or shX and selection applied for 7 days. At day 7, shL infected cells were additionally infected with X/R (shL: X/R), shX infected cells with X/R (shX: X/R) and shX infected cells with GFP (shX: GFP). Cells were selected and incubated for an additional 7 days before β-galactosidase staining. (A) Average % beta-galactosidase positive cells normalized to transduction efficiency (based on GFP) ±SEM is reported where >100 cells were counted per treatment in biological triplicate. (B) Representative images of each treatment condition. All images taken at 100X magnification and the same exposure time for brightfield or fluorescence images. (C) Western blot confirming HdmX knock-down and rescue in additional treatment conditions not present in Figure 3A. (D) Rt-PCR demonstrating relative expression of PAI-1 normalized to GAPDH in shLacZ or shHdmX infected LNCaP cells at day 14. Bars represent 95% confidence intervals.
Supplemental material

Additional material

Download Zip (81.3 KB)

Reprints and Corporate Permissions

Please note: Selecting permissions does not provide access to the full text of the article, please see our help page How do I view content?

To request a reprint or corporate permissions for this article, please click on the relevant link below:

Academic Permissions

Please note: Selecting permissions does not provide access to the full text of the article, please see our help page How do I view content?

Obtain permissions instantly via Rightslink by clicking on the button below:

If you are unable to obtain permissions via Rightslink, please complete and submit this Permissions form. For more information, please visit our Permissions help page.