686
Views
16
CrossRef citations to date
0
Altmetric
Report

The Lrs4-Csm1 monopolin complex associates with kinetochores during anaphase and is required for accurate chromosome segregation

, &
Pages 3611-3618 | Published online: 01 Sep 2010

Figures & data

Figure 1 Lrs4 and Csm1 localize to kinetochores or spindle pole bodies during mitotic anaphase. (A–C) Wild-type cells carrying an Lrs4-6HA and an Ndc80-GFP fusion (A15126) were arrested in G1 using α-factor pheromone (5 µg/ml) and released into medium lacking the pheromone at 25°C. At the indicated times, samples were taken to determine the percentage of cells with metaphase (diamonds) and anaphase (squares) spindles (A) and the percentage of cells showing co-localization of Lrs4-6HA with both, one or neither Ndc80-GFP marked spindle pole body (C) 200 cells were counted per time-point. The micrographs in (B) show Ndc80-GFP (green) and Lrs4-6HA (red) localization on chromosome spreads at 0, 45 and 75 minutes after release from the G1 arrest. DNA is shown in blue. At least 50 cells were counted per timepoint.
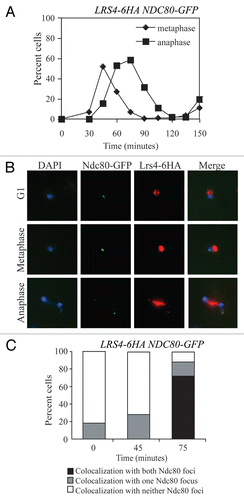
Figure 1 Lrs4 and Csm1 localize to kinetochores or spindle pole bodies during mitotic anaphase. (A–C) Wild-type cells carrying an Lrs4-6HA and an Ndc80-GFP fusion (A15126) were arrested in G1 using α-factor pheromone (5 µg/ml) and released into medium lacking the pheromone at 25°C. At the indicated times, samples were taken to determine the percentage of cells with metaphase (diamonds) and anaphase (squares) spindles (A) and the percentage of cells showing co-localization of Lrs4-6HA with both, one or neither Ndc80-GFP marked spindle pole body (C) 200 cells were counted per time-point. The micrographs in (B) show Ndc80-GFP (green) and Lrs4-6HA (red) localization on chromosome spreads at 0, 45 and 75 minutes after release from the G1 arrest. DNA is shown in blue. At least 50 cells were counted per timepoint.

Figure 2 Kinetochore association during anaphase is not a general feature of RENT complex components. Cells carrying Ndc80-GFP and either Lrs4-6HA (A15127), Fob1-13MYC (A20431), Sir2-13MYC (A20432) or Tof2-13MYC (A20433) fusions were released from a pheromone-induced G1 arrest at 25°C. The percent of anaphase cells showing co-localization of the tagged proteins with Ndc80-GFP was determined. At least 50 cells were counted per strain.
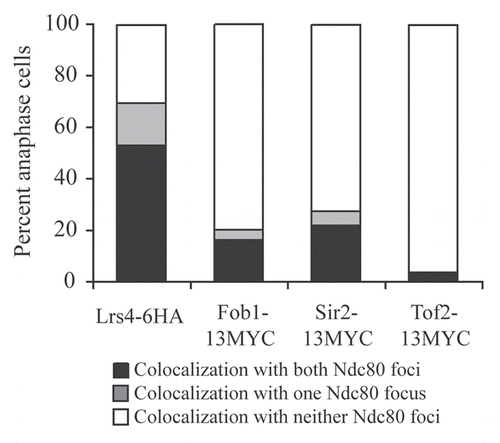
Figure 2 Kinetochore association during anaphase is not a general feature of RENT complex components. Cells carrying Ndc80-GFP and either Lrs4-6HA (A15127), Fob1-13MYC (A20431), Sir2-13MYC (A20432) or Tof2-13MYC (A20433) fusions were released from a pheromone-induced G1 arrest at 25°C. The percent of anaphase cells showing co-localization of the tagged proteins with Ndc80-GFP was determined. At least 50 cells were counted per strain.

Figure 3 The Mitotic Exit Network is required for Lrs4-Csm1 association with kinetochores during anaphase. (A and B) cdc15-2 (A16755) and cdc14-3 (A16802) cells carrying an Spc42-GFP and a Lrs4-6HA fusion were released from a pheromone-induced G1 arrest at 37°C. Chromosome spreads were performed on samples taken 150 minutes after release and the percentage of cells with Lrs4-6HA co-localized with Ndc80-GFP was determined (A). The micrographs in (B) show Lrs4-6HA (red) and Spc42-GFP (green) localization in cdc14-3 and cdc15-2 mutants. At least 50 cells were counted per strain.
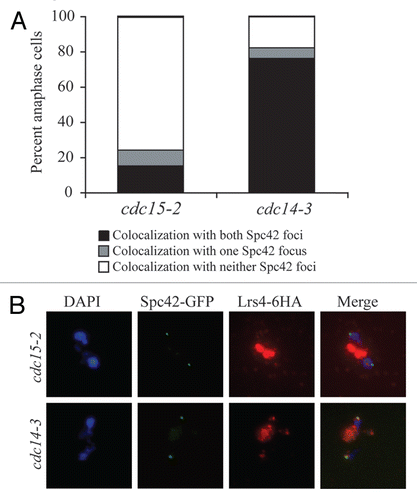
Figure 3 The Mitotic Exit Network is required for Lrs4-Csm1 association with kinetochores during anaphase. (A and B) cdc15-2 (A16755) and cdc14-3 (A16802) cells carrying an Spc42-GFP and a Lrs4-6HA fusion were released from a pheromone-induced G1 arrest at 37°C. Chromosome spreads were performed on samples taken 150 minutes after release and the percentage of cells with Lrs4-6HA co-localized with Ndc80-GFP was determined (A). The micrographs in (B) show Lrs4-6HA (red) and Spc42-GFP (green) localization in cdc14-3 and cdc15-2 mutants. At least 50 cells were counted per strain.

Figure 4 Lrs4 and Csm1 localize to kinetochores. (A) cdc14-3 (A16802) and ndc10-1 cdc14-3 (A17569) cells carrying an Spc42-GFP fusion were released from a pheromone-induced G1 arrest at 37°C. Chromosome spreads were performed 105 minutes after release and the percentage of cells with Lrs4-6HA co-localized with both or one Spc42-GFP signal was determined. At least 50 cells were counted per strain. (B) cdc14-3 cells carrying fusions of Dsn1-13MYC (A19333), Lrs4-6HA (A14204) or both (A19297) were released from a pheromone-induced G1 arrest at 37°C. Protein extracts were prepared from cells harvested 150 minutes after release. Lrs4-6HA was immunoprecipitated using an anti-HA antibody. Levels of Lrs4-6HA and Dsn1-13MYC were determined in the extracts (B, upper part) and in the precipitates (B, lower part).
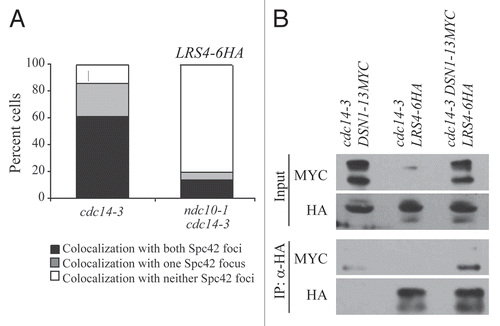
Figure 4 Lrs4 and Csm1 localize to kinetochores. (A) cdc14-3 (A16802) and ndc10-1 cdc14-3 (A17569) cells carrying an Spc42-GFP fusion were released from a pheromone-induced G1 arrest at 37°C. Chromosome spreads were performed 105 minutes after release and the percentage of cells with Lrs4-6HA co-localized with both or one Spc42-GFP signal was determined. At least 50 cells were counted per strain. (B) cdc14-3 cells carrying fusions of Dsn1-13MYC (A19333), Lrs4-6HA (A14204) or both (A19297) were released from a pheromone-induced G1 arrest at 37°C. Protein extracts were prepared from cells harvested 150 minutes after release. Lrs4-6HA was immunoprecipitated using an anti-HA antibody. Levels of Lrs4-6HA and Dsn1-13MYC were determined in the extracts (B, upper part) and in the precipitates (B, lower part).

Figure 5 Lrs4 and Csm1 are required for the faithful segregation of CEN plasmids. (A) Fluctuation analysis was performed to determine the rate of plasmid loss per generation (Materials and Methods) of wild-type (A18996), lrs4Δ (A18998), csm1Δ (A19000), lrs4Δ csm1Δ (A19002) or mcm21Δ (A20436) mutants carrying a centromeric plasmid (CEN plasmid). Each experiment consisted of three independent cultures and was repeated at least three times. Error bars represent standard error of the mean. (B) Fluctuation analysis was performed to determine the rate of plasmid loss per generation on wild-type (A19004), lrs4Δ (A19005), csm1Δ (A19006) and lrs4Δ csm1Δ (A19007) cells carrying a plasmid that contains only an autonomous replication sequence (ARS-only). Each experiment consisted of three independent cultures and was repeated at least three times. Error bars represent standard error of the mean.
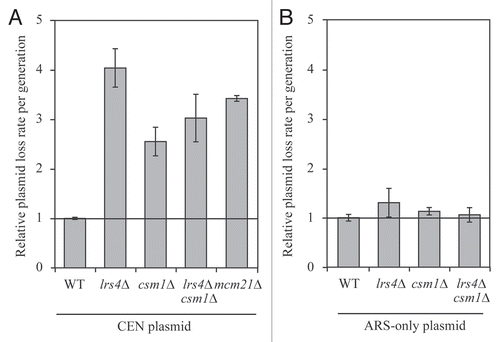
Figure 5 Lrs4 and Csm1 are required for the faithful segregation of CEN plasmids. (A) Fluctuation analysis was performed to determine the rate of plasmid loss per generation (Materials and Methods) of wild-type (A18996), lrs4Δ (A18998), csm1Δ (A19000), lrs4Δ csm1Δ (A19002) or mcm21Δ (A20436) mutants carrying a centromeric plasmid (CEN plasmid). Each experiment consisted of three independent cultures and was repeated at least three times. Error bars represent standard error of the mean. (B) Fluctuation analysis was performed to determine the rate of plasmid loss per generation on wild-type (A19004), lrs4Δ (A19005), csm1Δ (A19006) and lrs4Δ csm1Δ (A19007) cells carrying a plasmid that contains only an autonomous replication sequence (ARS-only). Each experiment consisted of three independent cultures and was repeated at least three times. Error bars represent standard error of the mean.

Figure 6 Spindle integrity is not defective in cells lacking LRS4 or CSM1. (A and B) Wild-type (A17064), lrs4Δ (A17061) and csm1Δ (A17063) cells were arrested in G1 using α-factor pheromone (5 µg/ml) and released into medium lacking the pheromone at 25°C. Samples were taken at the indicated times to determine the percent of cells in metaphase (diamonds; A) and anaphase (squares; A) and Pds1-9MYC levels (B). Pgk1 was used as a loading control in (B). (C) Wild-type (A2587), lrs4Δ (A13986), csm1Δ (A8623) and lrs4Δ csm1Δ (A18120) cells were spotted using 10-fold serial dilutions on YPD plates (YEP + 2% glucose) and YPD plates containing 5 µg/ml benomyl. (D and E) Wild-type (A5244; diamonds), ipl1-321 (A16485; squares), lrs4Δ (A15911; triangles), csm1Δ (A24385; exes) and lrs4Δ csm1Δ (A24386; circles) cells all carrying GFP dots at CENIV were arrested in G1 using α-factor pheromone (5 µg/ml) and released into medium containing 15 µg/ml nocodazole. After 80 minutes, cells were washed with YEP D containing 1% DMSO and released into YEP D medium containing 1% DMSO. Samples were taken at the indicated times to determine the percentage of cells in metaphase and anaphase (D) and the percent of anaphase cells in which both GFP dots segregated to the same pole (dark grey bars). (E) 200 cells were counted per time-point in (D) and per strain in (E). (F) cdc15-2 (A23341), cdc14-3 (A16736) and cdc14-3 lrs4Δ (A23340) cells carrying and Spc42-GFP fusion and CENIV GFP dots were arrested in G1 using α-factor (5 µg/ml) and released into medium lacking the pheromone at 37°C. At 240 minutes, the percent of cells with two (indicative of each CENIV region being tightly associated with SPB), three (indicative of only one CENIV region being tightly associated with SPB) or four (indicative of neither CENIV region being tightly associated with SPB) GFP foci was determined in anaphase cells 200 cells were counted per strain.
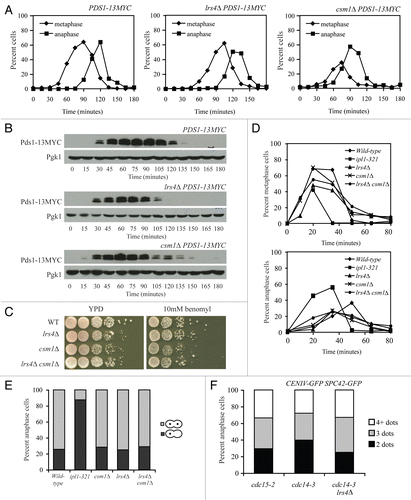
Figure 6 Spindle integrity is not defective in cells lacking LRS4 or CSM1. (A and B) Wild-type (A17064), lrs4Δ (A17061) and csm1Δ (A17063) cells were arrested in G1 using α-factor pheromone (5 µg/ml) and released into medium lacking the pheromone at 25°C. Samples were taken at the indicated times to determine the percent of cells in metaphase (diamonds; A) and anaphase (squares; A) and Pds1-9MYC levels (B). Pgk1 was used as a loading control in (B). (C) Wild-type (A2587), lrs4Δ (A13986), csm1Δ (A8623) and lrs4Δ csm1Δ (A18120) cells were spotted using 10-fold serial dilutions on YPD plates (YEP + 2% glucose) and YPD plates containing 5 µg/ml benomyl. (D and E) Wild-type (A5244; diamonds), ipl1-321 (A16485; squares), lrs4Δ (A15911; triangles), csm1Δ (A24385; exes) and lrs4Δ csm1Δ (A24386; circles) cells all carrying GFP dots at CENIV were arrested in G1 using α-factor pheromone (5 µg/ml) and released into medium containing 15 µg/ml nocodazole. After 80 minutes, cells were washed with YEP D containing 1% DMSO and released into YEP D medium containing 1% DMSO. Samples were taken at the indicated times to determine the percentage of cells in metaphase and anaphase (D) and the percent of anaphase cells in which both GFP dots segregated to the same pole (dark grey bars). (E) 200 cells were counted per time-point in (D) and per strain in (E). (F) cdc15-2 (A23341), cdc14-3 (A16736) and cdc14-3 lrs4Δ (A23340) cells carrying and Spc42-GFP fusion and CENIV GFP dots were arrested in G1 using α-factor (5 µg/ml) and released into medium lacking the pheromone at 37°C. At 240 minutes, the percent of cells with two (indicative of each CENIV region being tightly associated with SPB), three (indicative of only one CENIV region being tightly associated with SPB) or four (indicative of neither CENIV region being tightly associated with SPB) GFP foci was determined in anaphase cells 200 cells were counted per strain.
Supplemental material

Additional material

Download Zip (518.2 KB)