Figures & data
Figure 1 Non-canonical transcriptional regulation at the PUMA locus. (A) A linear scale model of the PUMA locus indicating the exon structure and dual transcription start sites followed by a schematic summary of ChIP data, DNase I accessibility data and RNA analysis. Primary ChIP data for H3K4me3, H3K9Ac, H3K9me3, CTCF and RNAPII was previously published in Gomes and Espinosa.Citation55 Primary data for H3K27me3 and USF2 is shown in (B). Data on DNaseI accessibility, USF1 occupancy and poly A- nuclear RNA was obtained from the USCS genome browser after analysis of publicly available genome wide datasets.Citation62,Citation66,Citation67 Several lines of experimental evidence supporting the existence of PUMA-TUF were published in Gomes and Espinosa.Citation55 PUMA locus conservation plot is an adapted view of VI STA plot data (http://genome.lbl.gov/vista/index.shtml) comparing human and murine genomic sequences. (B) ChIP assays were performed with whole-cell extracts from control and 5-FU-treated (8 h) HCT116 p53+/+ cells with antibodies recognizing H3K27me3 and USF2. The locus maps are a condensed scale model of those seen in (A). The location of 20 Real-Time PCR amplicons used in ChIP assays is also shown; red asterisks represent the p53RE s. The gray band represents the annotated transcribed region. (C) A model summarizing the transcriptional state of the PUMA locus prior to p53 activation.
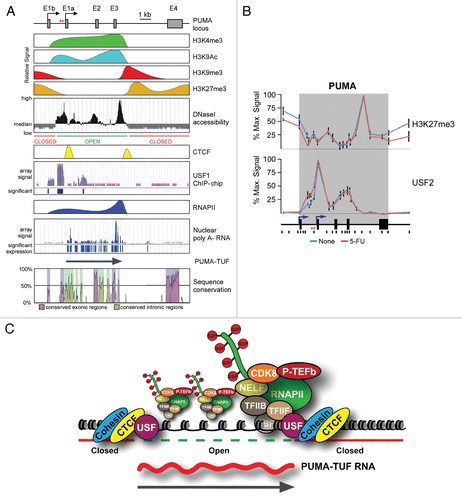
Figure 2 Models of potential CTCF-induced gene looping on the PUMA locus. (A) An adapted UCSC genome browser view of PUMA and surrounding genomic sequence displaying CTCF binding data from CD4+ T cellsCitation80 denoting potential CTCF looping sites. (B) A general schematic of potential PUMA locus intragenic and extragenic CTCF-mediated loops.
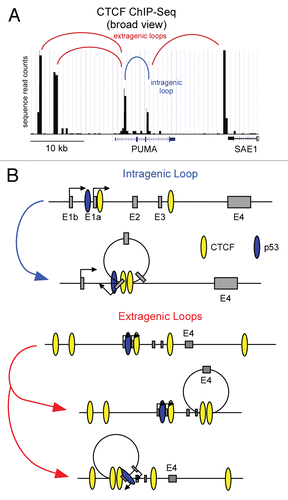
Figure 3 Rapid inactivation of p21 transcription following transient p53 activation in cells. (A) Experimental timeline. HCT116 cells were treated with Nutlin-3 for 8 h, drug was washed out and cell extracts were harvested at 0, 30, 60, 120 and 240 min following Nutlin-3 removal. (B) Western blot analysis demonstrating p53 accumulation in response to Nutlin-3 treatment and rapid degradation following drug removal. Nucleolin serves as a loading control. (C) A linear scale model of the p21 locus indicating exon structure, transcription start site and red asterisks representing the p53REs. The location of 8 PCR amplicons used in ChIP assays is also shown. ChIP assays were performed with antibodies recognizing total p53, H4Ac, CDK8, total RNAPII , S5P-CTD and S2P-CTD.
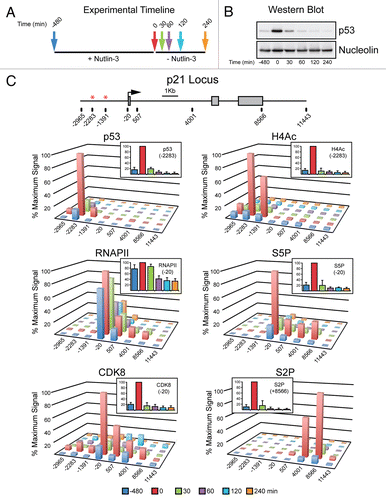
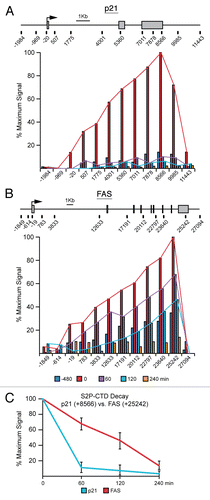
Figure 4 FAS displays extended transcriptional competence after p53 shut down. (A and B) Linear scale models of the p21 and FAS loci indicating exon structures and transcription start sites. The location of 12 PCR amplicons used in ChIP assays for each locus is also shown. ChIP assays were performed with antibodies recognizing S2P-CTD. (C) Summary of ChIP data from the 3′ end of p21 (+8,566) and FAS (+25,242) over the time course following Nutlin-3 treatment and removal.