432
Views
6
CrossRef citations to date
0
Altmetric
Research Paper

Phosphorylation of the rat Ins(1,4,5)P3 receptor at T930 within the coupling domain decreases its affinity to Ins(1,4,5)P3

, , , &
Pages 379-384 | Received 31 May 2012, Accepted 19 Jun 2012, Published online: 10 Aug 2012

Figures & data

Figure 1. Generation and characterization of stable DT40 cell lines expressing Ins(1,4,5)P3 receptor phosphorylation mutants. (A) Cartoon representation of Ins(1,4,5)P3 receptor structure with sequence alignment around T-930, for the rat (rIP3R), human (hIP3R) and Xenopus (xIP3R) Ins(1,4,5)P3 receptors. (B) Ins(1,4,5)P3R expression levels in the different cell lines. Different cell lines were generated using the DT40 cell line where all three Ins(1,4,5)P3R isoform are deleted (KO). The 3KO cells were electroporated with the linearized plasmid for either the T930A or T930E mutants. The plasmid carrying the mutants contains G418 resistance. Stable cell lines for each mutant were established using G418 selection. WT: DT40 cell line expressing only the wild-type Ins(1,4,5)P3 receptor (type 1); T930A and T930E: expressing the respective mutant Ins(1,4,5)P3Rs. (C) Growth rates of the different cell lines are also equivalent. The same number of cells was plated at time zero and cells were counted at different time points under equivalent culturing conditions to determine whether the expression of the different mutants affects cell growth. Although the T930E mutant grew at a slightly slower rate the difference were not significant. (D) Resting Ca2+ levels and store Ca2+ content were measured in DT40 cells loaded with Fura-2 and incubated in Ca2+-free solution. Ionomycin was added as indicated to release Ca2+ from stores.
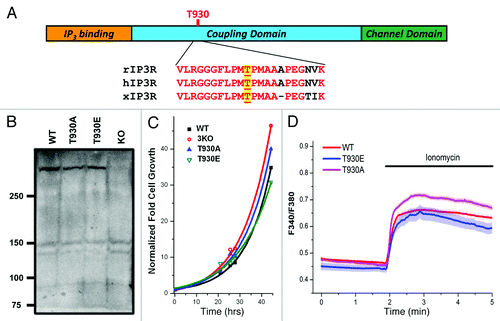
Figure 1. Generation and characterization of stable DT40 cell lines expressing Ins(1,4,5)P3 receptor phosphorylation mutants. (A) Cartoon representation of Ins(1,4,5)P3 receptor structure with sequence alignment around T-930, for the rat (rIP3R), human (hIP3R) and Xenopus (xIP3R) Ins(1,4,5)P3 receptors. (B) Ins(1,4,5)P3R expression levels in the different cell lines. Different cell lines were generated using the DT40 cell line where all three Ins(1,4,5)P3R isoform are deleted (KO). The 3KO cells were electroporated with the linearized plasmid for either the T930A or T930E mutants. The plasmid carrying the mutants contains G418 resistance. Stable cell lines for each mutant were established using G418 selection. WT: DT40 cell line expressing only the wild-type Ins(1,4,5)P3 receptor (type 1); T930A and T930E: expressing the respective mutant Ins(1,4,5)P3Rs. (C) Growth rates of the different cell lines are also equivalent. The same number of cells was plated at time zero and cells were counted at different time points under equivalent culturing conditions to determine whether the expression of the different mutants affects cell growth. Although the T930E mutant grew at a slightly slower rate the difference were not significant. (D) Resting Ca2+ levels and store Ca2+ content were measured in DT40 cells loaded with Fura-2 and incubated in Ca2+-free solution. Ionomycin was added as indicated to release Ca2+ from stores.

Figure 2. The T930E mutant exhibits decrease Ins(1,4,5)P3-dependent Ca2+ release sensitivity. DT40 cells were loaded with a Ca2+ dye and caged-Ins(1,4,5)P3 and exposed to different UV uncaging pulse durations to produce a dose response of Ins(1,4,5)P3 intracellulary. The level of Ca2+ release following the uncaging pulses was used as a measure of the sensitivity of the Ins(1,4,5)P3 receptor mutants as compared with the wild-type receptor.
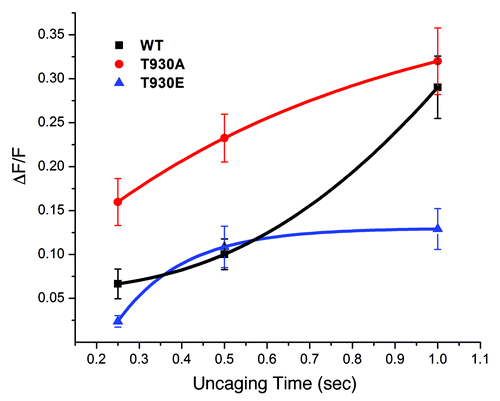
Figure 2. The T930E mutant exhibits decrease Ins(1,4,5)P3-dependent Ca2+ release sensitivity. DT40 cells were loaded with a Ca2+ dye and caged-Ins(1,4,5)P3 and exposed to different UV uncaging pulse durations to produce a dose response of Ins(1,4,5)P3 intracellulary. The level of Ca2+ release following the uncaging pulses was used as a measure of the sensitivity of the Ins(1,4,5)P3 receptor mutants as compared with the wild-type receptor.

Figure 3. The T930E mutation decreases Ins(1,4,5)P3 binding affinity. Microsomal preparations from brain as a positive control and from the different DT40 cell lines as indicated were subjected to the Ins(1,4,5)P3 binding assay to measure the binding affinity of Ins(1,4,5)P3 receptor mutants. Briefly lysates were allowed to bind radioactively (3H) labeled Ins(1,4,5)P3 and the label competed with cold Ins(1,4,5)P3. The competitive assay provides a relative comparative measure Ins(1,4,5)P3R affinity in the different mutants as compared with the wild type receptor (WT). The negative control was the 3KO cell line which does not express any of the three Ins(1,4,5)P3 receptor isoforms and as such provides non-specific background binding.
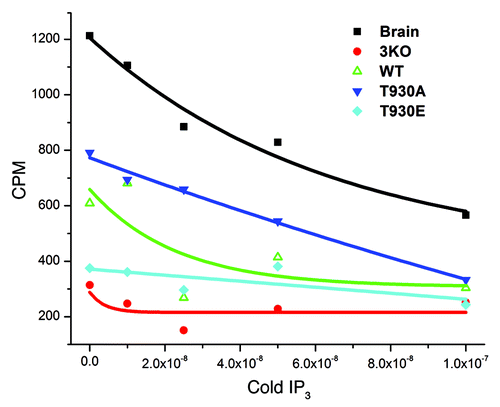
Figure 3. The T930E mutation decreases Ins(1,4,5)P3 binding affinity. Microsomal preparations from brain as a positive control and from the different DT40 cell lines as indicated were subjected to the Ins(1,4,5)P3 binding assay to measure the binding affinity of Ins(1,4,5)P3 receptor mutants. Briefly lysates were allowed to bind radioactively (3H) labeled Ins(1,4,5)P3 and the label competed with cold Ins(1,4,5)P3. The competitive assay provides a relative comparative measure Ins(1,4,5)P3R affinity in the different mutants as compared with the wild type receptor (WT). The negative control was the 3KO cell line which does not express any of the three Ins(1,4,5)P3 receptor isoforms and as such provides non-specific background binding.