647
Views
30
CrossRef citations to date
0
Altmetric
Technical Report

A plasma membrane-targeted cytosolic domain of STIM1 selectively activates ARC channels, an arachidonate-regulated store-independent Orai channel

&
Pages 370-378 | Received 23 Jul 2012, Accepted 23 Aug 2012, Published online: 01 Sep 2012

Figures & data

Figure 1. ARC and CRAC channel currents in HEK293 cells expressing the STIM1-CT construct. (A) Mean (± SE) I/V curves for the endogenous AA-activated ARC channels (black) and store-operated CRAC channels (gray) in HEK293 cells. (B) Representative western blot showing STIM1 levels in untransfected cells (C), in the same cells following treatment with a STIM1 siRNA (siR) and in the siRNA-treated cells following expression of the siRNA-resistant STIM1-CT construct (+ST). (C) Mean (± SE) ARC currents and CRAC currents measured at -80 mV in untransfected cells (white columns), in STIM1 siRNA-treated cells (gray columns) and in siRNA-treated cells following expression of the siRNA-resistant STIM1-CT construct (black columns). (D) Representative live confocal image of cells expressing the eGFP-tagged STIM1-CT construct.
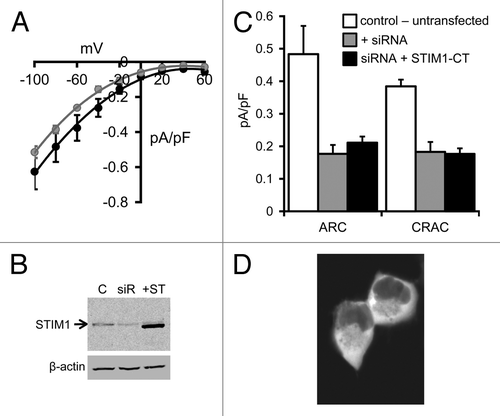
Figure 1. ARC and CRAC channel currents in HEK293 cells expressing the STIM1-CT construct. (A) Mean (± SE) I/V curves for the endogenous AA-activated ARC channels (black) and store-operated CRAC channels (gray) in HEK293 cells. (B) Representative western blot showing STIM1 levels in untransfected cells (C), in the same cells following treatment with a STIM1 siRNA (siR) and in the siRNA-treated cells following expression of the siRNA-resistant STIM1-CT construct (+ST). (C) Mean (± SE) ARC currents and CRAC currents measured at -80 mV in untransfected cells (white columns), in STIM1 siRNA-treated cells (gray columns) and in siRNA-treated cells following expression of the siRNA-resistant STIM1-CT construct (black columns). (D) Representative live confocal image of cells expressing the eGFP-tagged STIM1-CT construct.

Figure 2. Expression of the Lck-STIM1-C construct in HEK293 cells. (A) Representative live confocal image of cells expressing the Lck-STIM1-CT construct bearing a C-terminal eGFP-tag. (B) Mean (± SE) AA-activated ARC channel currents (black) and store-operated CRAC channel currents (gray) measured at -80 mV in siRNA-treated cells (siRNA), and in the same cells following expression of an siRNA-resistant wild-type STIM1 (+wt STIM1) or the siRNA-resistant Lck-STIM1-C construct (+Lck-STIM1-C). (C) Mean (± SE) I/V curves for the ARC channels (black) and CRAC channels (gray) in the siRNA-treated cells expressing the wild-type STIM1, and (D) the corresponding I/V curves for the ARC channels and CRAC channels in the siRNA-treated cells expressing the Lck-STIM1-C construct.
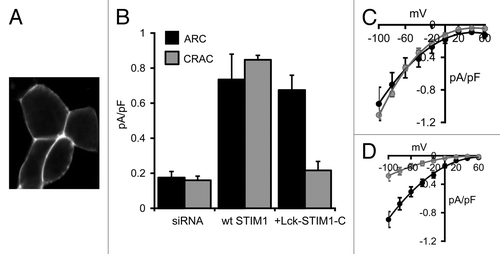
Figure 2. Expression of the Lck-STIM1-C construct in HEK293 cells. (A) Representative live confocal image of cells expressing the Lck-STIM1-CT construct bearing a C-terminal eGFP-tag. (B) Mean (± SE) AA-activated ARC channel currents (black) and store-operated CRAC channel currents (gray) measured at -80 mV in siRNA-treated cells (siRNA), and in the same cells following expression of an siRNA-resistant wild-type STIM1 (+wt STIM1) or the siRNA-resistant Lck-STIM1-C construct (+Lck-STIM1-C). (C) Mean (± SE) I/V curves for the ARC channels (black) and CRAC channels (gray) in the siRNA-treated cells expressing the wild-type STIM1, and (D) the corresponding I/V curves for the ARC channels and CRAC channels in the siRNA-treated cells expressing the Lck-STIM1-C construct.

Figure 3. Effect of the Lck-STIM1-C construct on CRAC channel activity in RBL cells. (A) Mean (± SE) store-operated CRAC channel currents measured at -80 mV in untransfected cells (untran), in cells expressing a control siRNA (cont siRNA), a STIM1 siRNA (siRNA) and in the same STIM1 siRNA-treated cells expressing an siRNA-resistant wild-type STIM1 (siRNA+WT) or an siRNA-resistant Lck-STIM1-C construct (siRNA+Lck). (B) Mean (± SE) I/V curves for CRAC channels in untransfected RBL cells (black), in STIM1 siRNA-treated cells (open circles) and in the same cells expressing the siRNA-resistant Lck-STIM1-C construct (gray circles). (C) Representative live confocal image of RBL cells expressing the Lck-STIM1-CT construct bearing a C-terminal eGFP-tag.
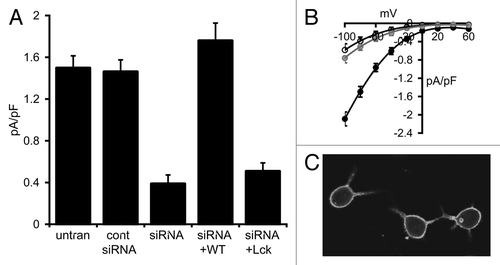
Figure 3. Effect of the Lck-STIM1-C construct on CRAC channel activity in RBL cells. (A) Mean (± SE) store-operated CRAC channel currents measured at -80 mV in untransfected cells (untran), in cells expressing a control siRNA (cont siRNA), a STIM1 siRNA (siRNA) and in the same STIM1 siRNA-treated cells expressing an siRNA-resistant wild-type STIM1 (siRNA+WT) or an siRNA-resistant Lck-STIM1-C construct (siRNA+Lck). (B) Mean (± SE) I/V curves for CRAC channels in untransfected RBL cells (black), in STIM1 siRNA-treated cells (open circles) and in the same cells expressing the siRNA-resistant Lck-STIM1-C construct (gray circles). (C) Representative live confocal image of RBL cells expressing the Lck-STIM1-CT construct bearing a C-terminal eGFP-tag.

Figure 4. Expression of the S to A mutant Lck-STIM1-C construct in HEK293 cells. (A) Representative live confocal image of cells expressing the mutant Lck-STIM1-CT construct bearing a C-terminal eGFP-tag. (B) Mean (± SE) AA-activated ARC channel currents measured at -80 mV in siRNA-treated cells expressing the siRNA-resistant Lck-STIM1-C construct (black), or the same siRNA-treated cells expressing the S to A mutant Lck-STIM1-C (gray). (C) The corresponding mean (± SE) I/V curves for the Lck-STIM1-C-expressing cells (black) and the mutant Lck-STIM1-C-expressing cells (gray). (D) Representative western blot showing relative expression of eGFP-tagged wild-type Lck-STIM1-C and the S to A mutant Lck-STIM1-C levels transfected into cells, as assessed by an eGFP Ab.
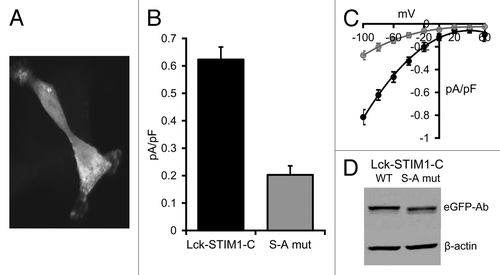
Figure 4. Expression of the S to A mutant Lck-STIM1-C construct in HEK293 cells. (A) Representative live confocal image of cells expressing the mutant Lck-STIM1-CT construct bearing a C-terminal eGFP-tag. (B) Mean (± SE) AA-activated ARC channel currents measured at -80 mV in siRNA-treated cells expressing the siRNA-resistant Lck-STIM1-C construct (black), or the same siRNA-treated cells expressing the S to A mutant Lck-STIM1-C (gray). (C) The corresponding mean (± SE) I/V curves for the Lck-STIM1-C-expressing cells (black) and the mutant Lck-STIM1-C-expressing cells (gray). (D) Representative western blot showing relative expression of eGFP-tagged wild-type Lck-STIM1-C and the S to A mutant Lck-STIM1-C levels transfected into cells, as assessed by an eGFP Ab.

Figure 5. Carbachol-activated currents in HEK cells expressing the Lck-STIM1-C construct. (A) Mean (± SE) carbachol-activated Ca2+ currents measured at -80 mV in HEK cells expressing the m3 muscarinic receptor. Shown are the total agonist-activated currents (gray), and the same currents recorded in cells after depletion of ER Ca2+ stores by intracellular adenophostin A (black) in untransfected control cells (control) and in STIM1 siRNA-treated cells expressing the Lck-STIM1-C construct. (B) Mean (± SE) I/V curves for the total agonist-activated currents (gray), and adenophostin-insensitive currents (black) in control cells and (C) the same for the Lck-STIM1-C expressing cells (see text for details). (D) Mean (± SE) curves comparing the activation kinetics of carbachol-activated currents in m3-HEK cells expressing the Lck-STIM1-C construct compared with those in wild-type m3-HEK cells. Total currents were normalized to their final maximal values to allow direct comparison of their respective rates of activation following addition of carbachol (10 µM) at time zero.
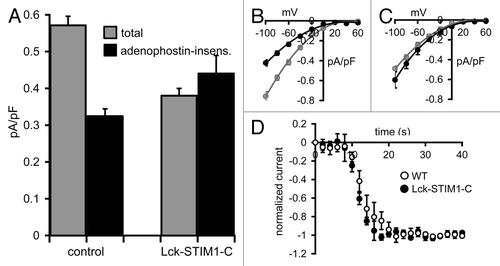
Figure 5. Carbachol-activated currents in HEK cells expressing the Lck-STIM1-C construct. (A) Mean (± SE) carbachol-activated Ca2+ currents measured at -80 mV in HEK cells expressing the m3 muscarinic receptor. Shown are the total agonist-activated currents (gray), and the same currents recorded in cells after depletion of ER Ca2+ stores by intracellular adenophostin A (black) in untransfected control cells (control) and in STIM1 siRNA-treated cells expressing the Lck-STIM1-C construct. (B) Mean (± SE) I/V curves for the total agonist-activated currents (gray), and adenophostin-insensitive currents (black) in control cells and (C) the same for the Lck-STIM1-C expressing cells (see text for details). (D) Mean (± SE) curves comparing the activation kinetics of carbachol-activated currents in m3-HEK cells expressing the Lck-STIM1-C construct compared with those in wild-type m3-HEK cells. Total currents were normalized to their final maximal values to allow direct comparison of their respective rates of activation following addition of carbachol (10 µM) at time zero.
Supplemental material

Additional material

Download Zip (199.2 KB)