579
Views
17
CrossRef citations to date
0
Altmetric
Article Addendum

Targeting KV channels rescues retinal ganglion cells in vivo directly and by reducing inflammation

&
Pages 337-346 | Received 13 May 2010, Accepted 25 Jun 2010, Published online: 15 Oct 2010

Figures & data

Figure 1 Inflammation and the microglial response after optic nerve transection. (A) Schematic showing the layers and neural types in the normal adult retina. The nerve fiber layer (NFL) is comprised of axons of retinal ganglion cells (RGCs); the ganglion cell layer (GCL) contains RGC somata; the inner plexiform layer (IPL) includes amacrine cells and processes of RGCs; the inner nuclear layer (IN L) contains bipolar cells; the outer plexiform layer (OPL) contains horizontal cells; and the outer nuclear layer (ONL) contains photoreceptors. (B–E) Representative confocal images from flat mounts of healthy retinas (n = 4 for each treatment), taken from the mid-periphery (see inset in ). RGCs and their axons were retrogradelabeled with Fluorogold (false-colored green); microglia were labeled with OX-42 antibody (red). The level at which each image was taken is indicated by corresponding red letter in (A). Microglia were very sparse in the outer plexiform layer (B). Highly ramified microglia were densely distributed in the inner plexiform layer (C), and adjacent to the GCL (D), where numerous RGC cell bodies can be seen. In the nerve fiber layer (E), only a few amoeboid microglia are seen among the RGC axon fascicles. Scale bar, 50 µm; applies to all parts. (F) Microglia in the NFL at 14 days after axotomy in a saline-injected retina. Some microglia (yellow in the overlay) are labeled with Fluorogold, as a result of phagocytosing apoptotic RGCs (green); the higher-magnification inset shows phagocytosed RGCs inside two microglia. Very few RGC cell bodies remain and their axons are no longer visible. Instead, there are large numbers of microglia, which are much less ramified than in the healthy retina and mainly organized in rows, similar to the RGC axon fascicles in the healthy retina (E). (G–I) Microglia in the NFL (14 days after axotomy), following intraocular KV blocker injections (50 µM) at the time of axotomy and 4 days later. The blockers were: agitoxin-2 (G), margatoxin (H) and α-dendrotoxin (I). (J) Changes in gene expression at 7 days after optic nerve transection, measured by quantitative real-time RT-PCR (for primer sequences, see ). One group of genes represents responses of microglia, complement receptor-3 (CR3) and MHC class II; astrocytes, glial fibrillary acidic protein (GFAP); and neurons, synaptophysin (SYP). The second includes cFos and the inflammation-related genes, TNFα, IL-1β, iNOS, IL-1 receptor antagonist (IL-1ra). For each gene, the relative expression was normalized to the housekeeping gene, HPRT-1, and values are shown as mean ± SEM (n = 6 retinas each), with significant differences (*p < 0.05; **p < 0.01) determined by ANOVA, followed by Fisher's test.
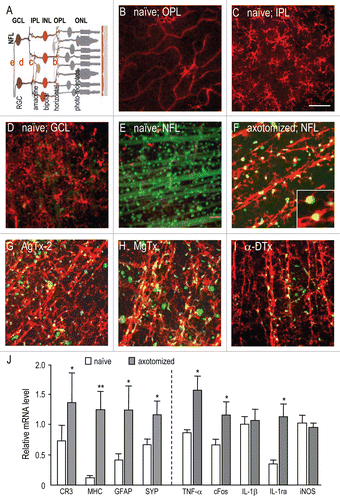
Figure 1 Inflammation and the microglial response after optic nerve transection. (A) Schematic showing the layers and neural types in the normal adult retina. The nerve fiber layer (NFL) is comprised of axons of retinal ganglion cells (RGCs); the ganglion cell layer (GCL) contains RGC somata; the inner plexiform layer (IPL) includes amacrine cells and processes of RGCs; the inner nuclear layer (IN L) contains bipolar cells; the outer plexiform layer (OPL) contains horizontal cells; and the outer nuclear layer (ONL) contains photoreceptors. (B–E) Representative confocal images from flat mounts of healthy retinas (n = 4 for each treatment), taken from the mid-periphery (see inset in Fig. 4E). RGCs and their axons were retrogradelabeled with Fluorogold (false-colored green); microglia were labeled with OX-42 antibody (red). The level at which each image was taken is indicated by corresponding red letter in (A). Microglia were very sparse in the outer plexiform layer (B). Highly ramified microglia were densely distributed in the inner plexiform layer (C), and adjacent to the GCL (D), where numerous RGC cell bodies can be seen. In the nerve fiber layer (E), only a few amoeboid microglia are seen among the RGC axon fascicles. Scale bar, 50 µm; applies to all parts. (F) Microglia in the NFL at 14 days after axotomy in a saline-injected retina. Some microglia (yellow in the overlay) are labeled with Fluorogold, as a result of phagocytosing apoptotic RGCs (green); the higher-magnification inset shows phagocytosed RGCs inside two microglia. Very few RGC cell bodies remain and their axons are no longer visible. Instead, there are large numbers of microglia, which are much less ramified than in the healthy retina and mainly organized in rows, similar to the RGC axon fascicles in the healthy retina (E). (G–I) Microglia in the NFL (14 days after axotomy), following intraocular KV blocker injections (50 µM) at the time of axotomy and 4 days later. The blockers were: agitoxin-2 (G), margatoxin (H) and α-dendrotoxin (I). (J) Changes in gene expression at 7 days after optic nerve transection, measured by quantitative real-time RT-PCR (for primer sequences, see Table 1). One group of genes represents responses of microglia, complement receptor-3 (CR3) and MHC class II; astrocytes, glial fibrillary acidic protein (GFAP); and neurons, synaptophysin (SYP). The second includes cFos and the inflammation-related genes, TNFα, IL-1β, iNOS, IL-1 receptor antagonist (IL-1ra). For each gene, the relative expression was normalized to the housekeeping gene, HPRT-1, and values are shown as mean ± SEM (n = 6 retinas each), with significant differences (*p < 0.05; **p < 0.01) determined by ANOVA, followed by Fisher's test.

Figure 2 KV block and RGC-specific knockdown differentially affect growth factor expression. Retinal expression of gene transcripts was compared by quantitative real-time RT-PCR at seven days after optic nerve transection. Expression of each gene was normalized to the value in untreated retinas after optic nerve transection (axotomized). Data are expressed as mean ± SEM (6 retinas each); the statistical significance was determined by ANOVA, followed by Fisher's test. (A) Effects of siRNA-mediated depletion of either KV1.1 or KV1.3 from RGCs only. Statistical comparisons between healthy retinas (naïve) and axotomized retinas are indicated (*p < 0.05), as are differences from retinas treated with control siRNA directed against firefly luciferase (#p < 0.05). (B) Two intraocular injections of 50 µM AgTx-2 or MgTx were given: one at the time of axotomy and another four days later. Comparisons are between the KV channel blockers and control (saline-injected) retinas (#p < 0.05, ##p < 0.01).
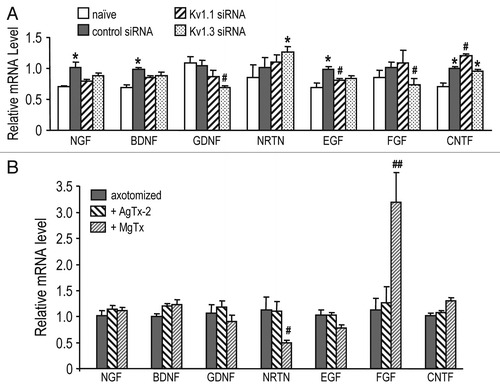
Figure 2 KV block and RGC-specific knockdown differentially affect growth factor expression. Retinal expression of gene transcripts was compared by quantitative real-time RT-PCR at seven days after optic nerve transection. Expression of each gene was normalized to the value in untreated retinas after optic nerve transection (axotomized). Data are expressed as mean ± SEM (6 retinas each); the statistical significance was determined by ANOVA, followed by Fisher's test. (A) Effects of siRNA-mediated depletion of either KV1.1 or KV1.3 from RGCs only. Statistical comparisons between healthy retinas (naïve) and axotomized retinas are indicated (*p < 0.05), as are differences from retinas treated with control siRNA directed against firefly luciferase (#p < 0.05). (B) Two intraocular injections of 50 µM AgTx-2 or MgTx were given: one at the time of axotomy and another four days later. Comparisons are between the KV channel blockers and control (saline-injected) retinas (#p < 0.05, ##p < 0.01).

Figure 3 Combining channel knockdown with KV1.3 blockade differentially affects inflammatory gene expression. Retinal expression of gene transcripts was assessed by quantitative real-time RT-PCR at seven days after optic nerve transection. shows the primer sequences used to detect these inflammation-related genes. Freshly cut nerve stumps were immediately injected with siRNA against KV1.1 or KV1.3, and compared with a control siRNA against firefly luciferase (as for ). When used, two intraocular injections of 50 µM AgTx-2 were given: one at the time of axotomy and another four days later (as for ). Expression of each gene was normalized to the value in axotomized retinas injected with the control siRNA. Data are expressed as mean ± SEM (six retinas each). The statistical significance was determined by AN OVA, followed by Fisher's test: *p < 0.05 indicates values that are significantly different from controls; #p < 0.05 indicates that the combination of the siRNA and AgTx-2 was significantly more effective than the siRNA alone.
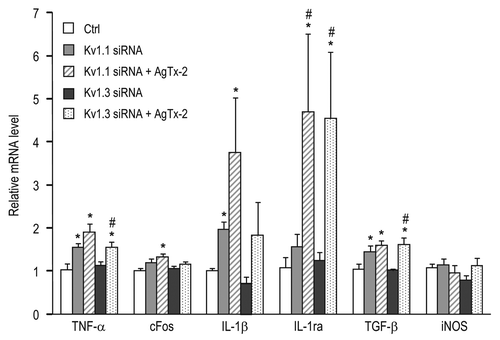
Figure 3 Combining channel knockdown with KV1.3 blockade differentially affects inflammatory gene expression. Retinal expression of gene transcripts was assessed by quantitative real-time RT-PCR at seven days after optic nerve transection. Table 1 shows the primer sequences used to detect these inflammation-related genes. Freshly cut nerve stumps were immediately injected with siRNA against KV1.1 or KV1.3, and compared with a control siRNA against firefly luciferase (as for Fig. 2A). When used, two intraocular injections of 50 µM AgTx-2 were given: one at the time of axotomy and another four days later (as for Fig. 2B). Expression of each gene was normalized to the value in axotomized retinas injected with the control siRNA. Data are expressed as mean ± SEM (six retinas each). The statistical significance was determined by AN OVA, followed by Fisher's test: *p < 0.05 indicates values that are significantly different from controls; #p < 0.05 indicates that the combination of the siRNA and AgTx-2 was significantly more effective than the siRNA alone.

Figure 4 Supra-additive RGC rescue by combined KV block and RGC-specific KV knockdown. (A–D) Representative confocal micrographs from flat-mounted retinas of adult rats at 14 days after axotomy. RGCs were retrograde labeled with Fluorogold applied to the freshly cut optic nerve stump (see Methods). In all examples, siRNA s were injected into the cut nerve stump immediately after optic nerve transection; scale bar, 50 µm in all panels. Few RGCs survived at this time following injection of control siRNA directed against firefly luciferase (A). (B) shows increased RGC survival after injecting combined siRNA s directed against KV1.1 (KV1.1–922) and KV1.3 (KV1.3–1169). Many more RGCs were seen after intraocular injection (on Day 4) of 50 µM agitoxin-2 (AgTx-2) was combined with injection of an siRNA directed against either KV1.1 (KV1.1–922; (C) or KV1.3 (D); KV1.3–1169). (E) Summary of RGC densities 14 days after axotomy. The inset cartoon shows the approximate locations of the 12 fields that were counted from the inner, mid-periphery and outer retinal eccentricities (four fields per site). The values for RGC density are mean ± SEM of four retinas in each experimental group. From left to right, the bars show the treatments: control siRNA against firefly luciferase (as above); an siRNA directed against KV1.1, combined with two different siRNA s directed against KV1.3; the KV1.1 siRNA combined with intraocular injection of 50 µM margatoxin (MgTx) or AgTx-2; one of the KV1.3 siRNA s combined with intraocular injection of 50 µM margatoxin (MgTx) or AgTx-2. The letters above each set of bars represent different statistical comparisons (ANOVA, followed by Fisher's test): (A) p < 0.001 with respect to the control siRNA; (B) p < 0.01 with respect to the combined siRNAs; (C) p < 0.001 with respect to KV1.1–922 or MgTx or AgTx-2 alone; (D) p < 0.001 with respect to KV1.3–1169 or MgTx or AgTx-2 alone.
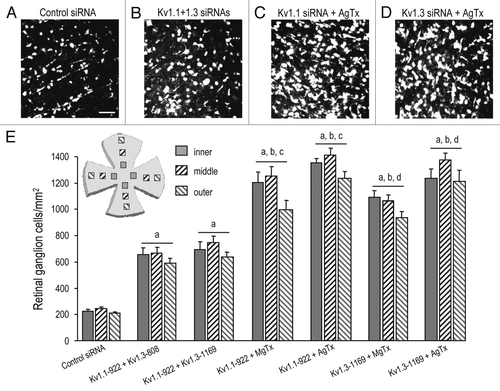
Figure 4 Supra-additive RGC rescue by combined KV block and RGC-specific KV knockdown. (A–D) Representative confocal micrographs from flat-mounted retinas of adult rats at 14 days after axotomy. RGCs were retrograde labeled with Fluorogold applied to the freshly cut optic nerve stump (see Methods). In all examples, siRNA s were injected into the cut nerve stump immediately after optic nerve transection; scale bar, 50 µm in all panels. Few RGCs survived at this time following injection of control siRNA directed against firefly luciferase (A). (B) shows increased RGC survival after injecting combined siRNA s directed against KV1.1 (KV1.1–922) and KV1.3 (KV1.3–1169). Many more RGCs were seen after intraocular injection (on Day 4) of 50 µM agitoxin-2 (AgTx-2) was combined with injection of an siRNA directed against either KV1.1 (KV1.1–922; (C) or KV1.3 (D); KV1.3–1169). (E) Summary of RGC densities 14 days after axotomy. The inset cartoon shows the approximate locations of the 12 fields that were counted from the inner, mid-periphery and outer retinal eccentricities (four fields per site). The values for RGC density are mean ± SEM of four retinas in each experimental group. From left to right, the bars show the treatments: control siRNA against firefly luciferase (as above); an siRNA directed against KV1.1, combined with two different siRNA s directed against KV1.3; the KV1.1 siRNA combined with intraocular injection of 50 µM margatoxin (MgTx) or AgTx-2; one of the KV1.3 siRNA s combined with intraocular injection of 50 µM margatoxin (MgTx) or AgTx-2. The letters above each set of bars represent different statistical comparisons (ANOVA, followed by Fisher's test): (A) p < 0.001 with respect to the control siRNA; (B) p < 0.01 with respect to the combined siRNAs; (C) p < 0.001 with respect to KV1.1–922 or MgTx or AgTx-2 alone; (D) p < 0.001 with respect to KV1.3–1169 or MgTx or AgTx-2 alone.

Table 1 Primers used for real-time quantitative real-time RT-PCR