Figures & data
Figure 1 Ion-selective electrodes. A) NA+-selective electrode (left) and reference electrode (right). B) Ion-selective (left) and reference (right) electrodes mounted in their respective holders. C) Custom-made dishes for mounting and measuring from eyes (left) and tadpoles (right).
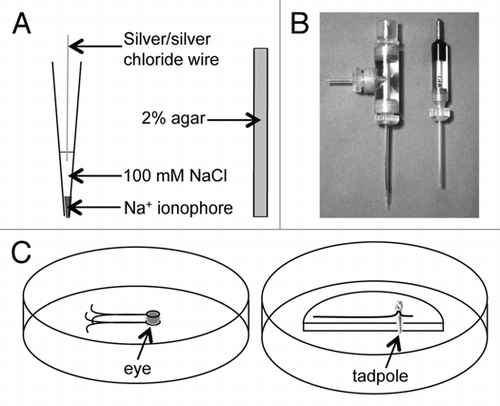
Figure 2 Measuring and calibration. (A) As the ion-selective electrode moves in an ion gradient, near a source or sink of ion flux, the potential on the electrode varies in proportion to the size of the flux (B). The higher value at the near position indicates an outward ion flux (efflux) in this case. This is an actual trace recorded from a Ca2+ electrode near a corneal wound. note that although there is some slight drift downwards in the trace the actual flux (difference between near and far) is quite consistent. Time between points on the x-axis is 6 sec. (C) Calibration of the Ca2+ electrode used in (B) in three solutions (0.1, 1 and 10 mM CaCl2.2H2O; logs of molar concentration: -4, -3, -2). The formula describing the linear best fit line is used to calculate the actual ion flux (see Methods).
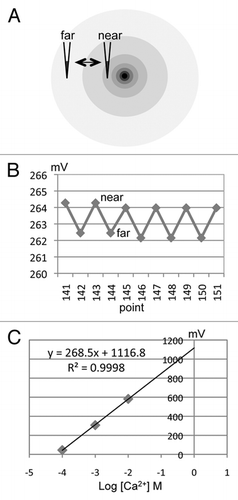
Figure 3 Cornea wound measurements. Cornea wounding induces different K+ and Ca2+ fluxes. After wounding (at time zero), K+ flux rises and falls rapidly, suggesting this is passive leakage from damaged cells, which contain high [K+]. In contrast, Ca2+ flux rises slowly and is maintained at a high level, suggesting that Ca2+ efflux is an active response to corneal injury. Data adapted from Vieira et al., 2011.Citation14
![Figure 3 Cornea wound measurements. Cornea wounding induces different K+ and Ca2+ fluxes. After wounding (at time zero), K+ flux rises and falls rapidly, suggesting this is passive leakage from damaged cells, which contain high [K+]. In contrast, Ca2+ flux rises slowly and is maintained at a high level, suggesting that Ca2+ efflux is an active response to corneal injury. Data adapted from Vieira et al., 2011.Citation14](/cms/asset/ff1ae060-2063-403f-9719-25b1466c2d8b/kcib_a_10916182_f0003.gif)
Table 1 Examples of commonly used ionophores