386
Views
12
CrossRef citations to date
0
Altmetric
Short Communication

Temporal responses of wild-type pigmentation and RcaE-deficient strains of Fremyelladiplosiphon during light transitions

&
Pages 503-510 | Received 01 Jun 2011, Accepted 03 Jun 2011, Published online: 01 Sep 2011

Figures & data

Figure 1 Growth of wild-type pigmentation strain SF33 and RcaE-deficient mutant (ΔrcaE) strain of F. diplosiphon under shifts between green and red light. (A) Cell growth was estimated as scattering of light (i.e., optical density or O.D.) at 750 nm and (B) total cellular protein content (µg ml−1) during 15 days of exposure to green light (GL) and red light (RL) after transition of RL-acclimated cultures to GL and vice versa.
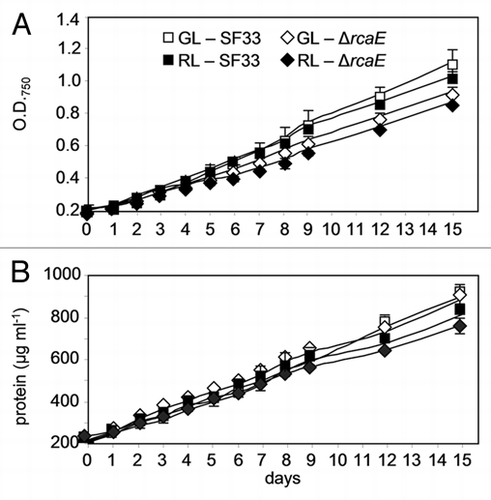
Figure 1 Growth of wild-type pigmentation strain SF33 and RcaE-deficient mutant (ΔrcaE) strain of F. diplosiphon under shifts between green and red light. (A) Cell growth was estimated as scattering of light (i.e., optical density or O.D.) at 750 nm and (B) total cellular protein content (µg ml−1) during 15 days of exposure to green light (GL) and red light (RL) after transition of RL-acclimated cultures to GL and vice versa.

Figure 2 Chlorophyll content in wild-type pigmentation strain SF33 and RcaE-deficient mutant (ΔrcaE) strain of F. diplosiphon under shifts between green and red light. Chlorophyll a (chla) concentration was determined during 15 days of exposure to green light (GL) and red light (RL) after transition of RL-acclimated cultures to GL and vice versa. Asterisks represent significant difference from 0 day (*p < 0.05), similar alphabets over the bars indicate homogenous mean group while a line over the bars show no significant difference (p > 0.05) between treatment at each time interval.
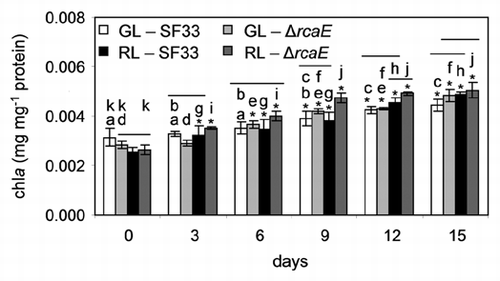
Figure 2 Chlorophyll content in wild-type pigmentation strain SF33 and RcaE-deficient mutant (ΔrcaE) strain of F. diplosiphon under shifts between green and red light. Chlorophyll a (chla) concentration was determined during 15 days of exposure to green light (GL) and red light (RL) after transition of RL-acclimated cultures to GL and vice versa. Asterisks represent significant difference from 0 day (*p < 0.05), similar alphabets over the bars indicate homogenous mean group while a line over the bars show no significant difference (p > 0.05) between treatment at each time interval.

Figure 3 Phycobiliprotein content in SF33 wild-type pigmentation strain of F. diplosiphon under shifts between green and red light. Concentration of phycobiliproteins, including phycocyanin (PC), allophycocyanin (AP) and phycoerythrin (PE) were determined during 15 days of exposure to green light (GL) and red light (RL) after transition of RL-acclimated cultures to GL and vice versa. Similar alphabets over the bars represent no significant difference between pigment levels (p > 0.05).
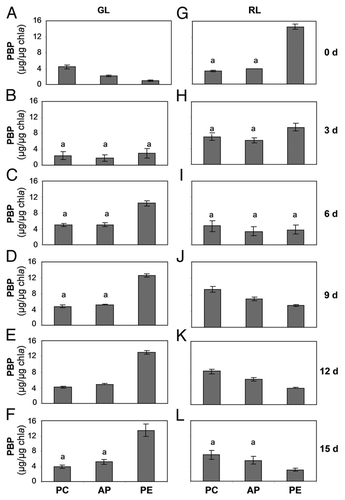
Figure 3 Phycobiliprotein content in SF33 wild-type pigmentation strain of F. diplosiphon under shifts between green and red light. Concentration of phycobiliproteins, including phycocyanin (PC), allophycocyanin (AP) and phycoerythrin (PE) were determined during 15 days of exposure to green light (GL) and red light (RL) after transition of RL-acclimated cultures to GL and vice versa. Similar alphabets over the bars represent no significant difference between pigment levels (p > 0.05).
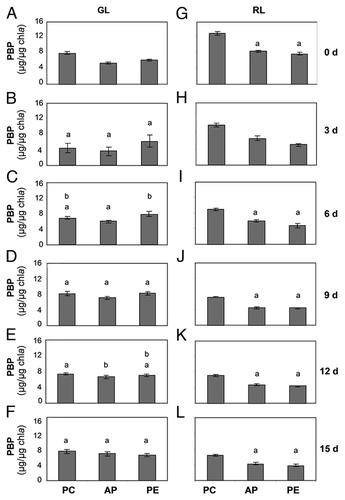
Figure 4 Phycobiliprotein content in RcaE-deficient mutant (ΔrcaE) strain of F. diplosiphon under shifts between green and red light. Concentration of phycobiliproteins, including phycocyanin (PC), allophycocyanin (AP) and phycoerythrin (PE) were determined during 15 days of exposure to green light (GL) and red light (RL) after transition of RL-acclimated cultures to GL and vice versa. Similar alphabets over the bars represent no significant difference between pigment levels (p > 0.05).

Figure 4 Phycobiliprotein content in RcaE-deficient mutant (ΔrcaE) strain of F. diplosiphon under shifts between green and red light. Concentration of phycobiliproteins, including phycocyanin (PC), allophycocyanin (AP) and phycoerythrin (PE) were determined during 15 days of exposure to green light (GL) and red light (RL) after transition of RL-acclimated cultures to GL and vice versa. Similar alphabets over the bars represent no significant difference between pigment levels (p > 0.05).

Figure 5 Phycobiliprotein distributions in wild-type pigmentation strain SF33 and RcaE-deficient mutant (ΔrcaE) strain under shifts between green and red light. Percentage distribution of phycocyanin (PC), allophycocyanin (AP) and phycoerythrin (PE) were calculated for strains during 15 days of exposure to green light (GL) and red light (RL) after transition of RL-acclimated cultures to GL and vice versa.
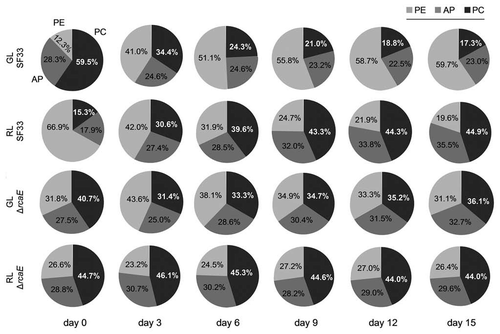
Figure 5 Phycobiliprotein distributions in wild-type pigmentation strain SF33 and RcaE-deficient mutant (ΔrcaE) strain under shifts between green and red light. Percentage distribution of phycocyanin (PC), allophycocyanin (AP) and phycoerythrin (PE) were calculated for strains during 15 days of exposure to green light (GL) and red light (RL) after transition of RL-acclimated cultures to GL and vice versa.