1,159
Views
49
CrossRef citations to date
0
Altmetric
Article Addendum

Effect of fingerprints orientation on skin vibrations during tactile exploration of textured surfaces

, &
Pages 422-424 | Received 17 May 2009, Accepted 20 May 2009, Published online: 30 Sep 2009

Figures & data

Figure 1 (A) Experimental set-up. The substrate (in grey) consists of a 50 mm long glass slide patterned with 1D rough textures (see ref. Citation14 for details). It is mounted on a double cantilever apparatus which allows one to monitor both the normal and tangential forces (denoted N and F, respectively) acting on it. The forefinger (male, 37 years old) is constrained in a fixed position at 45° with respect to the surface. Once in place, the substrate is brought in contact at a prescribed load N. It is then moved at a constant speed v = 5 mm/s using a DC-current motor along either distal (mode 1, right) or radial (mode 2, left) direction. (B) Typical images of the contact zone between the fingertip and a smooth substrate for 4 different loads (0.2, 0.4, 0.8, 1.6 N). The finger is pointing upward. The arrows correspond to the scanning direction in mode 1 (blue) and mode 2 (red). The white bar is 2 mm long. (C) Comparison of the normalized power spectra of the tangential force F obtained in mode 1 (blue, shifted vertically for clarity) and mode 2 (red). The different graphs corresponds to loads N = 0.2, 0.4, 0.8, 1.2, 1.7 N. (D) Linear/linear plot of the spectra for N = 0.4 N. The maximum of the normalized power spectrum in mode 1 occurs at the spatial frequency 2 mm−1. Inset: spectrum amplitude at this particular spatial frequency as a function of N.
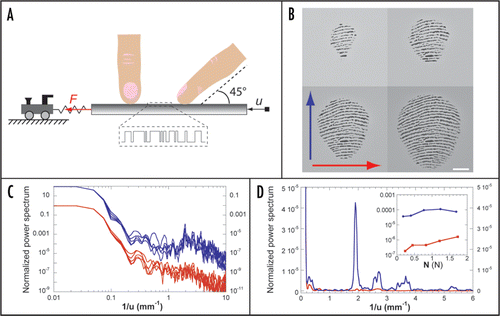
Figure 1 (A) Experimental set-up. The substrate (in grey) consists of a 50 mm long glass slide patterned with 1D rough textures (see ref. Citation14 for details). It is mounted on a double cantilever apparatus which allows one to monitor both the normal and tangential forces (denoted N and F, respectively) acting on it. The forefinger (male, 37 years old) is constrained in a fixed position at 45° with respect to the surface. Once in place, the substrate is brought in contact at a prescribed load N. It is then moved at a constant speed v = 5 mm/s using a DC-current motor along either distal (mode 1, right) or radial (mode 2, left) direction. (B) Typical images of the contact zone between the fingertip and a smooth substrate for 4 different loads (0.2, 0.4, 0.8, 1.6 N). The finger is pointing upward. The arrows correspond to the scanning direction in mode 1 (blue) and mode 2 (red). The white bar is 2 mm long. (C) Comparison of the normalized power spectra of the tangential force F obtained in mode 1 (blue, shifted vertically for clarity) and mode 2 (red). The different graphs corresponds to loads N = 0.2, 0.4, 0.8, 1.2, 1.7 N. (D) Linear/linear plot of the spectra for N = 0.4 N. The maximum of the normalized power spectrum in mode 1 occurs at the spatial frequency 2 mm−1. Inset: spectrum amplitude at this particular spatial frequency as a function of N.