Figures & data
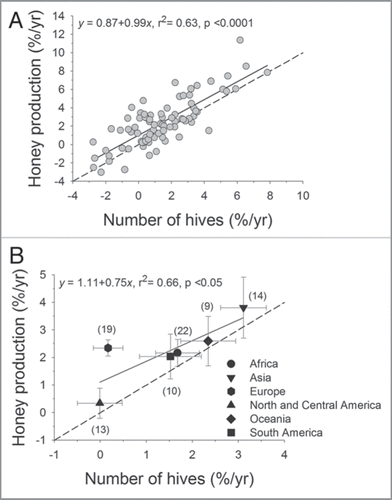
Figure 1 Relations between the annual growth rates in honey-bee stocks and honey production for (A) 87 countries and (B) six continents. Solid lines indicate the fitted linear regressions and dashed lines depict equal growth in both variables. In (B), points represent continental means ± SE, and sample sizes (number of countries) are provided in parentheses.
Supplemental material