511
Views
8
CrossRef citations to date
0
Altmetric
Short Communication

Pericentrin in health and disease

Exploring the patchwork of Pericentrin splice variants

&
Pages 304-307 | Published online: 01 Jul 2012

Figures & data

Figure 1. Mouse and Human Pericentrin variants and Pericentrin distribution in human embryonic kidney cells. (A) Scheme of the known and published Pericentrin (Pcnt) splice variants: Pcnt B human (Kendrin, accession number (AN: NP_006022), Pcnt B mouse (Pcnt 360, AN: NP_032813 or BAF36559), Pcnt A mouse (AN: partial, AAO24322.1) and Pcnt S mouse (Pcnt 250, BAF36560). Human Pcnt is larger than mouse Pcnt—white bars in the mouse Pcnt variants indicate missing sequence parts. The homology between human and mouse Pcnt is about 60%. The epitopes of the affinity purified MmPeriC1 antibody and the Ab4448 antibody are indicated in gray. (B-I) Triple labeling of Pcnt (green, B and F), ac. tubulin (marker particularly for primary cilia, red, C and G), and DAPI (blue, E and I) in human embryonic kidney cells (HEK-293T cells). Pcnt is localized at the centrosomes of resting and dividing cells and at the basal body complex of primary cilia (arrows; primary cilium marked with an asterisk)). Moreover it accumulates in the nucleoli of interphase cells (arrowheads) and can be found distributed throughout the cytoplasm at granular appearing structures. (D, H) Merge of the Pcnt and ac. tubulin staining. (E, I) Merge of the Pcnt, ac. tubulin and DAPI staining. Scale bar: 5 µm (E, I).
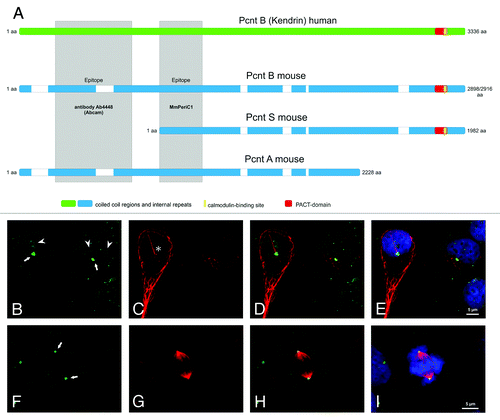
Figure 1. Mouse and Human Pericentrin variants and Pericentrin distribution in human embryonic kidney cells. (A) Scheme of the known and published Pericentrin (Pcnt) splice variants: Pcnt B human (Kendrin, accession number (AN: NP_006022), Pcnt B mouse (Pcnt 360, AN: NP_032813 or BAF36559), Pcnt A mouse (AN: partial, AAO24322.1) and Pcnt S mouse (Pcnt 250, BAF36560). Human Pcnt is larger than mouse Pcnt—white bars in the mouse Pcnt variants indicate missing sequence parts. The homology between human and mouse Pcnt is about 60%. The epitopes of the affinity purified MmPeriC1 antibody and the Ab4448 antibody are indicated in gray. (B-I) Triple labeling of Pcnt (green, B and F), ac. tubulin (marker particularly for primary cilia, red, C and G), and DAPI (blue, E and I) in human embryonic kidney cells (HEK-293T cells). Pcnt is localized at the centrosomes of resting and dividing cells and at the basal body complex of primary cilia (arrows; primary cilium marked with an asterisk)). Moreover it accumulates in the nucleoli of interphase cells (arrowheads) and can be found distributed throughout the cytoplasm at granular appearing structures. (D, H) Merge of the Pcnt and ac. tubulin staining. (E, I) Merge of the Pcnt, ac. tubulin and DAPI staining. Scale bar: 5 µm (E, I).

Figure 2. Expression of Pericentrin splice variants in different mouse and human tissues and cells. Every lane is loaded with approximately the same amount of protein. (A) Western blot analysis of mouse protein extracts of retina, olfactory epithelium and NIH 3T3 mouse fibroblasts using the MmPeriC1 antibody. A ~360 kDa protein band—mouse Pericentrin (Pcnt) B—is detected in all three samples. A second protein band with varying molecular weight—~250 kDa (most likely mouse Pcnt A and/or S) in olfactory epithelium and NIH 3T3 mouse fibroblasts, ~225 kDa (most likely a variant of mouse Pcnt S) in retina—suggests the existence of different Pcnt variants in different tissues, which are expressed at different protein levels. The third band in the olfactory epithelium at ~190 kDa might be a cleaved part of Pcnt, since it does not appear constantly in every experiment. (B) Western blot analysis of human protein extracts of HEK-293T cells (embryonic kidney), HeLa cells (cervical cancer), MCF-7 cells and MDA-MB 231 cells (both breast cancer) using the MmPeriC1 antibody. The ~380 kDa human Pcnt B is detected as a double band with different expression levels in the different cell lines. The constantly appearing double band might show a posttranslational modification of Pcnt B resulting in a weight shift. All four human cell extracts show a second and a third band with with molecular weights of ~270 kDa and 220 kDa (potentially human Pcnt A and S). In the three cancer cell lines an additional Pcnt positive band at ~200 kDa appears. All human cell lines show different expression levels of distinct bands, suggesting a unique expression pattern of different Pcnt splice variants in every human tissue. (C) Control western blot analysis of the human cell extracts used in B. Preadsorption of the MmPeriC1 antibody with the respective antigen in saturating concentrations blocks the detection of the protein bands in all human cell samples. For detailed experimental information see ref. Citation11.
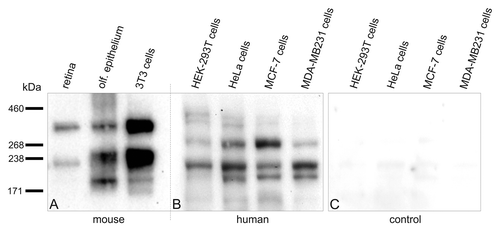
Figure 2. Expression of Pericentrin splice variants in different mouse and human tissues and cells. Every lane is loaded with approximately the same amount of protein. (A) Western blot analysis of mouse protein extracts of retina, olfactory epithelium and NIH 3T3 mouse fibroblasts using the MmPeriC1 antibody. A ~360 kDa protein band—mouse Pericentrin (Pcnt) B—is detected in all three samples. A second protein band with varying molecular weight—~250 kDa (most likely mouse Pcnt A and/or S) in olfactory epithelium and NIH 3T3 mouse fibroblasts, ~225 kDa (most likely a variant of mouse Pcnt S) in retina—suggests the existence of different Pcnt variants in different tissues, which are expressed at different protein levels. The third band in the olfactory epithelium at ~190 kDa might be a cleaved part of Pcnt, since it does not appear constantly in every experiment. (B) Western blot analysis of human protein extracts of HEK-293T cells (embryonic kidney), HeLa cells (cervical cancer), MCF-7 cells and MDA-MB 231 cells (both breast cancer) using the MmPeriC1 antibody. The ~380 kDa human Pcnt B is detected as a double band with different expression levels in the different cell lines. The constantly appearing double band might show a posttranslational modification of Pcnt B resulting in a weight shift. All four human cell extracts show a second and a third band with with molecular weights of ~270 kDa and 220 kDa (potentially human Pcnt A and S). In the three cancer cell lines an additional Pcnt positive band at ~200 kDa appears. All human cell lines show different expression levels of distinct bands, suggesting a unique expression pattern of different Pcnt splice variants in every human tissue. (C) Control western blot analysis of the human cell extracts used in B. Preadsorption of the MmPeriC1 antibody with the respective antigen in saturating concentrations blocks the detection of the protein bands in all human cell samples. For detailed experimental information see ref. Citation11.
Supplemental material

Additional material

Download Zip (5.4 MB)