1,884
Views
40
CrossRef citations to date
0
Altmetric
Mini Review

Anti-cancer drug discovery and development

Bcl-2 family small molecule inhibitors

&
Pages 557-565 | Published online: 01 Nov 2012

Figures & data

Figure 1. Regulation of apoptosis by the Bcl-2 family. The anti-apoptotic Bcl-2 protein family members include Bcl-2, Bcl-XL, Bcl-w, Mcl-1, and Bfl-1/A1. In the indirect activation model, the anti-apoptotic proteins sequester Bax and Bak through physical interactions. The upregulation of BH3-only proteins will disrupt this interaction, releasing Bax and Bak to oligomerize, allowing mitochondrial outer membrane permeabilization (MOMP), the release of key factors such as cytochrome c, and the induction of apoptosis. In the direct activation model, anti-apoptotic Bcl-2 protein members sequester BH3 activators including Puma, Bid, and Bim. BH3 sensitizers are able to disrupt this interaction, and the released activators directly activate Bax and Bak to allow MOMP and apoptosis. It is most likely that these two models happen in tandem.
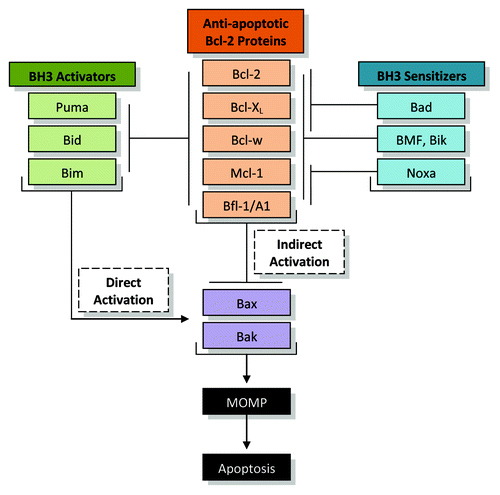
Figure 1. Regulation of apoptosis by the Bcl-2 family. The anti-apoptotic Bcl-2 protein family members include Bcl-2, Bcl-XL, Bcl-w, Mcl-1, and Bfl-1/A1. In the indirect activation model, the anti-apoptotic proteins sequester Bax and Bak through physical interactions. The upregulation of BH3-only proteins will disrupt this interaction, releasing Bax and Bak to oligomerize, allowing mitochondrial outer membrane permeabilization (MOMP), the release of key factors such as cytochrome c, and the induction of apoptosis. In the direct activation model, anti-apoptotic Bcl-2 protein members sequester BH3 activators including Puma, Bid, and Bim. BH3 sensitizers are able to disrupt this interaction, and the released activators directly activate Bax and Bak to allow MOMP and apoptosis. It is most likely that these two models happen in tandem.

Figure 2. The selectivity of Bcl-2 SMIs. For each drug, green indicates relatively high affinity for the protein, orange indicates relatively low affinity for the protein, and red indicates no affinity for the protein was detected. Black indicates a lack of published data. The colors assigned were based on the drug’s affinities relative to the affinity of ABT-737 against Bcl-2, as well as on the relative affinities between the drug’s targets.
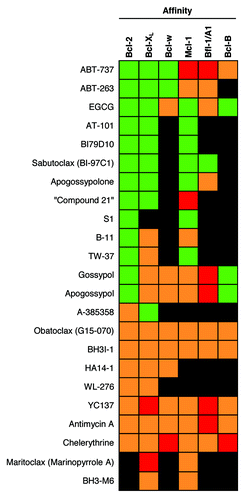
Figure 2. The selectivity of Bcl-2 SMIs. For each drug, green indicates relatively high affinity for the protein, orange indicates relatively low affinity for the protein, and red indicates no affinity for the protein was detected. Black indicates a lack of published data. The colors assigned were based on the drug’s affinities relative to the affinity of ABT-737 against Bcl-2, as well as on the relative affinities between the drug’s targets.

Figure 3. The potency of Bcl-2 SMIs currently in clinical trials against various cancer cells in culture. Green indicates high potency for the cancer type with an average EC50 value below 1 µM, orange indicates a moderate potency with an average EC50 value between 1 and 10 µM, and red indicates a low potency with an average EC50 value above 10 µM. Black indicates that no published EC50 exists for that drug and cancer type. The white numbers inside the box signify the number of experiments examined to obtain the average.
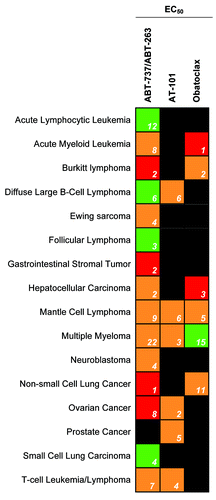
Figure 3. The potency of Bcl-2 SMIs currently in clinical trials against various cancer cells in culture. Green indicates high potency for the cancer type with an average EC50 value below 1 µM, orange indicates a moderate potency with an average EC50 value between 1 and 10 µM, and red indicates a low potency with an average EC50 value above 10 µM. Black indicates that no published EC50 exists for that drug and cancer type. The white numbers inside the box signify the number of experiments examined to obtain the average.