657
Views
8
CrossRef citations to date
0
Altmetric
Research Paper

Genome wide comparative comprehensive analysis of Plasmodium falciparum MCM family with human host

&
Pages 607-615 | Published online: 01 Nov 2012

Figures & data

Table 1. MCM family of Plasmodium falciparum

Figure 1. Comparison of MCM2–6 of Plasmodium falciparum with their human homologs. All the sequence data used in the analysis were downloaded from PlasmoDB (www.plasmodb.org). The downloaded sequences were used as query to match with the human homolog using BLAST search (www.ncbi.nlm.nih.gov). The corresponding human sequence was retrieved and the domain analysis was done. The results were further checked manually to confirm that all the domains are present and then used in the figures. Similarly the P. falciparum sequence was also analyzed and the results are presented in figures. The conserved sequences of each domain are written inside the boxes. The text in blue refers to the names of various conserved domains and the numbers refer to the amino acids positions of various domains. The number I, II and III refer to Walker A or motif I, Walker B or motif II and arginine finger motif respectively. This figure is not drawn to scale.
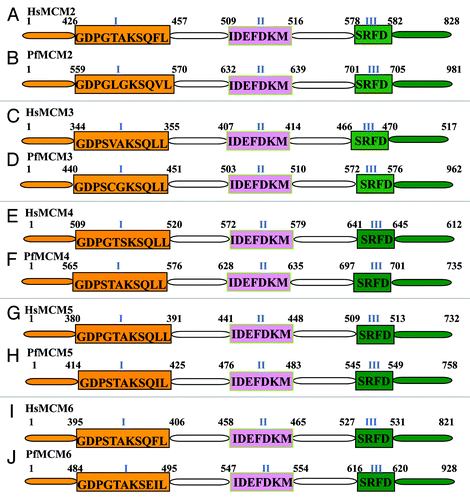
Figure 1. Comparison of MCM2–6 of Plasmodium falciparum with their human homologs. All the sequence data used in the analysis were downloaded from PlasmoDB (www.plasmodb.org). The downloaded sequences were used as query to match with the human homolog using BLAST search (www.ncbi.nlm.nih.gov). The corresponding human sequence was retrieved and the domain analysis was done. The results were further checked manually to confirm that all the domains are present and then used in the figures. Similarly the P. falciparum sequence was also analyzed and the results are presented in figures. The conserved sequences of each domain are written inside the boxes. The text in blue refers to the names of various conserved domains and the numbers refer to the amino acids positions of various domains. The number I, II and III refer to Walker A or motif I, Walker B or motif II and arginine finger motif respectively. This figure is not drawn to scale.

Figure 2. (A-F) Comparison of MCM7–9 of Plasmodium falciparum with their human homologs. All the sequence data used in the analysis were downloaded from PlasmoDB (www.plasmodb.org). The downloaded sequences were used as query to match with the human homolog using BLAST search (www.ncbi.nlm.nih.gov). The corresponding human sequence was retrieved and the domain analysis was done. Other details are as in . This figure is not drawn to scale. (G and H) Distribution of amino acids at various positions in (G). ‘Walker motif A; (H) ‘Walker motif B’ of MCM2–9 of P. falciparum. Single letter code for amino acids has been used. This analysis was done using MEME program. (I-K) The modeled structure of (I). template (J). PfMCM9 and (K). superimposition are shown. The PfMCM9 sequence was submitted to Swissmodel server and the structure was obtained. The molecular graphic images were produced using the UCSF Chimera package from the resource for Biocomputing, Visualization, and Informatics (www.cgl.ucsf.edu/chimera) at the University of California, San Francisco (supported by NIH P41 RR-01081). The details are described in text.
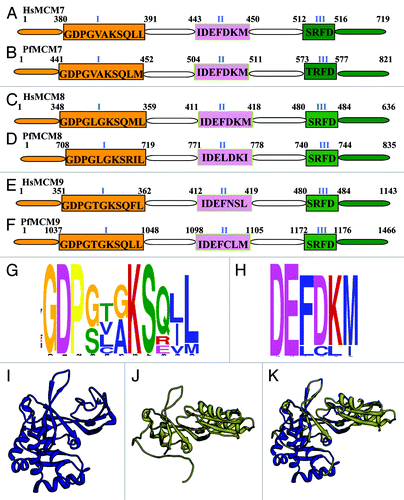
Figure 2. (A-F) Comparison of MCM7–9 of Plasmodium falciparum with their human homologs. All the sequence data used in the analysis were downloaded from PlasmoDB (www.plasmodb.org). The downloaded sequences were used as query to match with the human homolog using BLAST search (www.ncbi.nlm.nih.gov). The corresponding human sequence was retrieved and the domain analysis was done. Other details are as in Figure 1. This figure is not drawn to scale. (G and H) Distribution of amino acids at various positions in (G). ‘Walker motif A; (H) ‘Walker motif B’ of MCM2–9 of P. falciparum. Single letter code for amino acids has been used. This analysis was done using MEME program. (I-K) The modeled structure of (I). template (J). PfMCM9 and (K). superimposition are shown. The PfMCM9 sequence was submitted to Swissmodel server and the structure was obtained. The molecular graphic images were produced using the UCSF Chimera package from the resource for Biocomputing, Visualization, and Informatics (www.cgl.ucsf.edu/chimera) at the University of California, San Francisco (supported by NIH P41 RR-01081). The details are described in text.

Figure 3. Phosphorylation sites in Hs and PfMCMs. The sequence of each MCM was submitted to www.cbs.dtu.dk/services/NetPhosK for predictions of kinase specific eukaryotic protein phosphorylation sites. A threshold of 0.7 was used and the sites predicted for each MCM are presented in the figure. CKII- casein kinase II, PKA-protein kinase A, PKB-protein kinase B, PKC-protein kinase C.
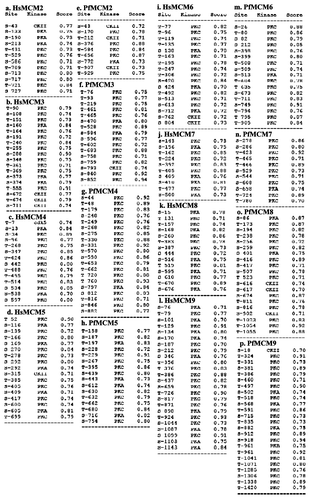
Figure 3. Phosphorylation sites in Hs and PfMCMs. The sequence of each MCM was submitted to www.cbs.dtu.dk/services/NetPhosK for predictions of kinase specific eukaryotic protein phosphorylation sites. A threshold of 0.7 was used and the sites predicted for each MCM are presented in the figure. CKII- casein kinase II, PKA-protein kinase A, PKB-protein kinase B, PKC-protein kinase C.