414
Views
2
CrossRef citations to date
0
Altmetric
Short Communication

Input-specific homeostatic regulation of AMPA receptor accumulation at central synapses

&
Pages 553-556 | Published online: 01 Nov 2012

Figures & data

Figure 1. Illustration of UV-induced activation of a single synapse. (A) In a neuron expressing LiGluR, a brief UV exposure (1 sec, arrow) triggered rapid depolarization and high-frequency firing of action potentials, which was terminated by a brief blue light (0.3 sec) stimulation. (B) In a neuron expressing both LiGluR and a synaptic maker protein synapsin-YFP, activity was induced by UV exposure and AMPAR amount at the activated synapse was reduced.
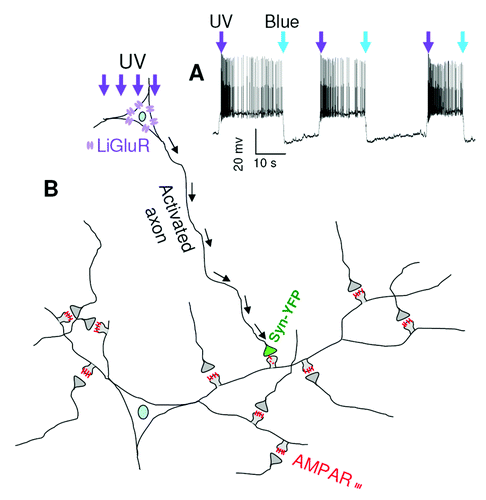
Figure 1. Illustration of UV-induced activation of a single synapse. (A) In a neuron expressing LiGluR, a brief UV exposure (1 sec, arrow) triggered rapid depolarization and high-frequency firing of action potentials, which was terminated by a brief blue light (0.3 sec) stimulation. (B) In a neuron expressing both LiGluR and a synaptic maker protein synapsin-YFP, activity was induced by UV exposure and AMPAR amount at the activated synapse was reduced.

Figure 2. Examination of AMPAR diffusion into the dendritic shaft. Following GluA1 immunostaining in UV treated neurons, LiGluR synapses were selected as indicated by synapsin-YFP (arrows) for line plotting (A and B). GluA1 intensity across the spine and base dendritic region was plotted (C). GluA1 intensity ratio of spine neck vs. base dendrite showed no difference between control and UV treated samples (D). (E and F) GluA1 intensity was measured at different dendritic sites flanking the activated spine. For each set of measurements, values were normalized to the mean of the two end sites (sites A and E). Control was from neurons transfected with the same constructs (LiGluR and syn-YFP), but treated with blue light only.
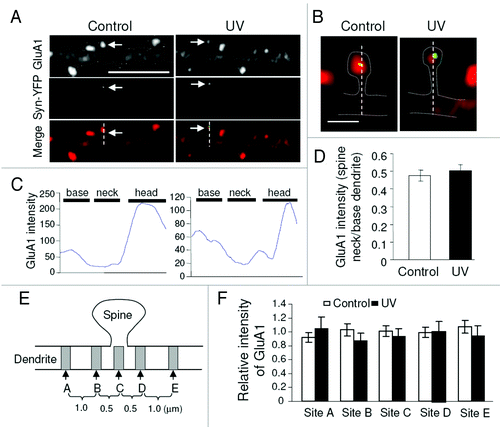
Figure 2. Examination of AMPAR diffusion into the dendritic shaft. Following GluA1 immunostaining in UV treated neurons, LiGluR synapses were selected as indicated by synapsin-YFP (arrows) for line plotting (A and B). GluA1 intensity across the spine and base dendritic region was plotted (C). GluA1 intensity ratio of spine neck vs. base dendrite showed no difference between control and UV treated samples (D). (E and F) GluA1 intensity was measured at different dendritic sites flanking the activated spine. For each set of measurements, values were normalized to the mean of the two end sites (sites A and E). Control was from neurons transfected with the same constructs (LiGluR and syn-YFP), but treated with blue light only.

Figure 3. Chemical LTD does not occlude homeostatic AMPAR reduction. In neurons transfected with LiGluR and synapsin-YFP, NMDA (50 μM, 5 min) was applied to induce LTD, followed by UV stimulation. Both cell-surface and total amount of GluA1 was immunostained under non-permeant and permeant conditions, respectively. In the presence of chemical LTD, GluA1 still showed a reduction at the UV activated synapses (arrows) compared with the neighboring sites.

Figure 3. Chemical LTD does not occlude homeostatic AMPAR reduction. In neurons transfected with LiGluR and synapsin-YFP, NMDA (50 μM, 5 min) was applied to induce LTD, followed by UV stimulation. Both cell-surface and total amount of GluA1 was immunostained under non-permeant and permeant conditions, respectively. In the presence of chemical LTD, GluA1 still showed a reduction at the UV activated synapses (arrows) compared with the neighboring sites.