431
Views
0
CrossRef citations to date
0
Altmetric
Article Addendum

Collective behavior of Dictyostelium discoideum monitored by impedance analysis

, , , , , , , & show all
Article: e23894 | Received 05 Feb 2013, Accepted 05 Feb 2013, Published online: 01 May 2013

Figures & data

Figure 1. (A) Schematic illustration of the experiment comprising electric cell-substrate impedance sensing (ECIS) setup mounted on top of an optical microscope. The complex impedance between the small working electrode and the large counter electrode is measured with an impedance analyzer (SI 1260). (B) Optical micrograph of a D. discoideum covered gold-electrode. (C) Magnitude of normalized impedance of an ECIS electrode measured at 4 kHz (|Znorm|4kHz) as a function of time. The black box highlights the time period during which collective oscillations occur due to starvation conditions (C, right graph).
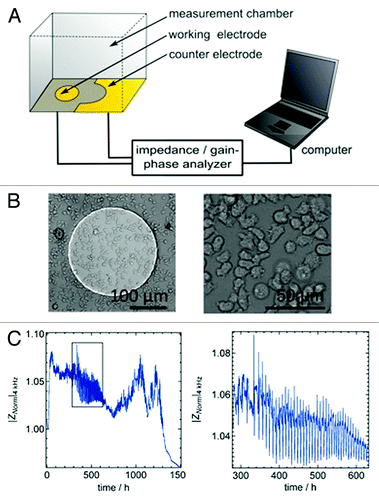
Figure 1. (A) Schematic illustration of the experiment comprising electric cell-substrate impedance sensing (ECIS) setup mounted on top of an optical microscope. The complex impedance between the small working electrode and the large counter electrode is measured with an impedance analyzer (SI 1260). (B) Optical micrograph of a D. discoideum covered gold-electrode. (C) Magnitude of normalized impedance of an ECIS electrode measured at 4 kHz (|Znorm|4kHz) as a function of time. The black box highlights the time period during which collective oscillations occur due to starvation conditions (C, right graph).

Figure 2. (A) Microfluidic device prepared by micromolding in capillaries to monitor impedance fluctuations due to cell movements and shape changes within in the micro channel. The two entrances of the channel are equipped with two opposing electrodes. (B) The optical micrographs are taken with an inverted micrograph and show the amoebae dwelling in the channel. (C) Starvation triggers impedance oscillations in micro channel with a similar period as those found in ECIS measurements (blue lines). The zoom-in on the right side has been detrended to emphasize the impedance oscillations. (D) Scheme of the two proposed states that amoebae assume during impedance oscillations. At the impedance maxima the overall contact zone and the cell-cell contacts increase.
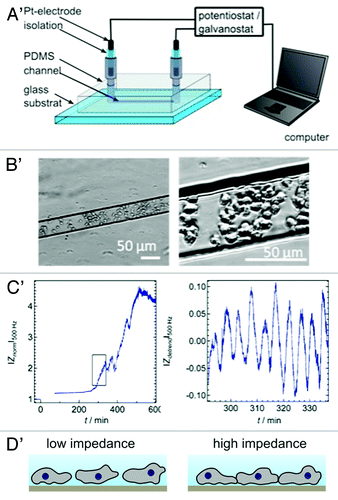
Figure 2. (A) Microfluidic device prepared by micromolding in capillaries to monitor impedance fluctuations due to cell movements and shape changes within in the micro channel. The two entrances of the channel are equipped with two opposing electrodes. (B) The optical micrographs are taken with an inverted micrograph and show the amoebae dwelling in the channel. (C) Starvation triggers impedance oscillations in micro channel with a similar period as those found in ECIS measurements (blue lines). The zoom-in on the right side has been detrended to emphasize the impedance oscillations. (D) Scheme of the two proposed states that amoebae assume during impedance oscillations. At the impedance maxima the overall contact zone and the cell-cell contacts increase.