379
Views
3
CrossRef citations to date
0
Altmetric
Article Addendum

Tentative and transient natural killer cell polarization balances the requirements for discriminatory recognition and cytolytic efficacy

, &
Pages 545-548 | Received 25 Jun 2010, Accepted 25 Jun 2010, Published online: 01 Nov 2010

Figures & data

Figure 1 Schematic representation of cytolytic effector polarization. The progression of the different cytolytic effector/target cell couples as indicated from initial polarization within seconds of tight cell coupling (left) to sustained polarization over several minutes (right) is depicted. The thickness of the arrow indicates efficacy of progression. For innate cytokine-primed NK cells two distinct cell couples fates exist. The target cell is in blue, loss of color and shape denotes lysis. The cytolytic effector is transparent. The position of the MTOC is given in yellow, interface accumulation with its spatiotemporal patterning of actin and active Cdc42 in red and green, respectively. Color intensity indicates extent of accumulation.
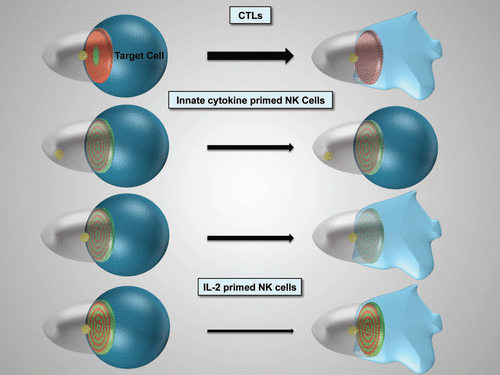
Figure 1 Schematic representation of cytolytic effector polarization. The progression of the different cytolytic effector/target cell couples as indicated from initial polarization within seconds of tight cell coupling (left) to sustained polarization over several minutes (right) is depicted. The thickness of the arrow indicates efficacy of progression. For innate cytokine-primed NK cells two distinct cell couples fates exist. The target cell is in blue, loss of color and shape denotes lysis. The cytolytic effector is transparent. The position of the MTOC is given in yellow, interface accumulation with its spatiotemporal patterning of actin and active Cdc42 in red and green, respectively. Color intensity indicates extent of accumulation.

Figure 2 Accumulation of active Cdc42 is focused on the center of the interface. (A) The % sensor for active Cdc42 translocated to the cytolytic effector/target cell interface is given as a function of time relative to tight cell coupling with standard errors for the following interactions: P14 T cells/EL4 target cells/10 µm gp33 agonist peptide or IL-12/18 NK cells with YAC-1 target cells, as indicated. The 64, 35 cell couples were analyzed per condition. The data are part of ref. Citation5. (B) The % sensor for active Cdc42 translocated to the cytolytic effector/target cell interface is normalized to the size of the area of accumulation relative to the interface size. This measure is referred to as the centrality index in ref. Citation22. (C and D) For IL-12/18 NK cell/YAC-1 interactions, the data from (A and B) are displayed separately for non-killing (broken line) and lytic (solid line) interactions.
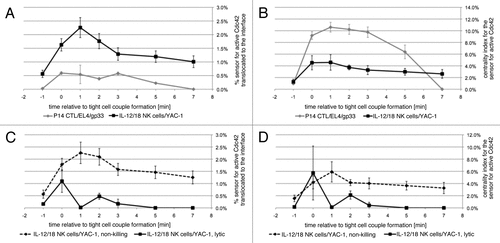
Figure 2 Accumulation of active Cdc42 is focused on the center of the interface. (A) The % sensor for active Cdc42 translocated to the cytolytic effector/target cell interface is given as a function of time relative to tight cell coupling with standard errors for the following interactions: P14 T cells/EL4 target cells/10 µm gp33 agonist peptide or IL-12/18 NK cells with YAC-1 target cells, as indicated. The 64, 35 cell couples were analyzed per condition. The data are part of ref. Citation5. (B) The % sensor for active Cdc42 translocated to the cytolytic effector/target cell interface is normalized to the size of the area of accumulation relative to the interface size. This measure is referred to as the centrality index in ref. Citation22. (C and D) For IL-12/18 NK cell/YAC-1 interactions, the data from (A and B) are displayed separately for non-killing (broken line) and lytic (solid line) interactions.