Figures & data
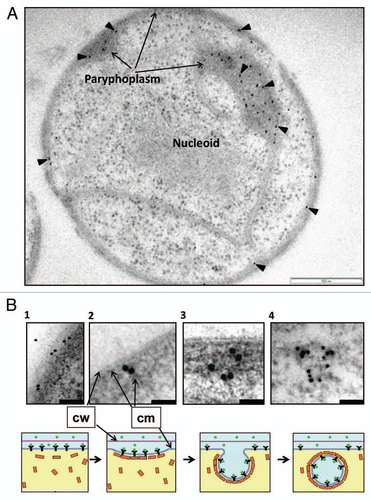
Figure 1 TEM of sectioned high-pressure frozen cryosubstituted G. obscuriglobus cell pre-incubated with GFP (A), and a proposed model of the events involved in uptake of extracellular proteins (B). The sectioned cell seen in (A) has been immunolabeled via anti-GFP antibody and the antibody visualized with 10 nm gold (arrowheads)—labeling is concentrated in the paryphoplasm region. Bar = 500 nm. (B) Micrographs in the top row show enlarged views of the potential different stages of GFP uptake at peripheral cytoplasmic membrane and paryphoplasm in cells of G. obscuriglobus. Bacteria were incubated with GFP, immunolabelled with anti-GFP antibody and processed and sectioned for TEM as for (A). Gold particles indicating GFP can be seen associated with cytoplasmic membrane (B1 and B2) and then with the membrane of vesicles inside the paryphoplasm region in the cell interior (B3 and B4). The schematic series of diagrams in the bottom row show corresponding suggested stages for the GFP uptake process and its mechanism, consistent with evidence from micrographs; stage 1 shows binding of GFP to membrane receptors, and stages 2 and 3 show initial steps of invagination of plasma membrane and association of GFP with vesicles in the process of being generated. At the final stage (stage 4) the vesicle formation is complete. In this model GFP ligand in the external milieu binds to receptors in the cytoplasmic membrane, MC-like (clathrin-like) protein coats the outside of the vesicle via cage formation and ligand becomes oriented to the inside membrane surface of the vesicle during its formation due to the effect of infolding. Infolding and formation of vesicles occurs in the paryphoplasm. Arrows indicate cytoplasmic membrane (cm) and cell wall (cw); green circles in the model indicate GFP; yellow rectangles, MC-like proteins; black Y's, protein receptor. Bars = 200 nm (micrograph B1), 50 nm (micrograph 2 and 3) and 100 nm (micrograph B4).