585
Views
8
CrossRef citations to date
0
Altmetric
Article Addendum

A comprehensive strategy to identify stoichiometric membrane protein interactomes

, , , &
Pages 189-196 | Published online: 31 Dec 2012

Figures & data

Figure 1. Membrane topology of Ano1. Model of mouse Ano1 topology. This model is based on data from Yu et al. (2012).Citation14 In this model the sequence 628–638 forms the outer vestibule of the channel and amino acids in the first and third intracellular loops are involved in Ca-dependent gating. See Yu et al. for further details.Citation14
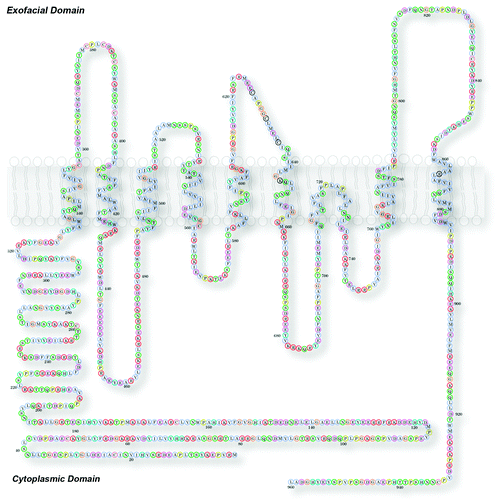
Figure 1. Membrane topology of Ano1. Model of mouse Ano1 topology. This model is based on data from Yu et al. (2012).Citation14 In this model the sequence 628–638 forms the outer vestibule of the channel and amino acids in the first and third intracellular loops are involved in Ca-dependent gating. See Yu et al. for further details.Citation14

Figure 2. Subcellular localization of the Ano1 signaling complex. This complex is shown here by the colocalization of Ano1 (green), the acting binding signaling protein ezrin (red) and actin (blue) in the apical membranes of acinar and duct cells of the submaxillary gland of mouse. The white strings represent the canalicullar lumen highlighted by the overlapping fluorescent signals. The landmark asterisk in the merged panel is enlarged to the right. Cell diagram depicts a submaxillary secreting cell and its relative position in the acinus. A yellow band on the apical domain marks the localization of ezrin and Ano1. Diagram was modified from Lentz.Citation30 Bar 10 microns.
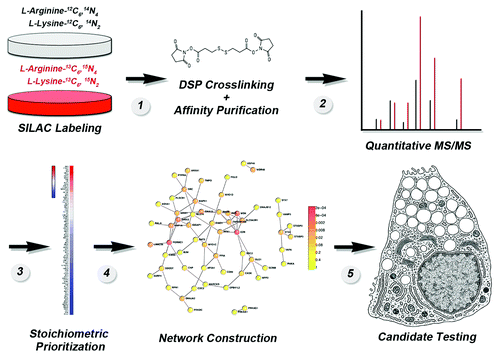
Figure 2. Subcellular localization of the Ano1 signaling complex. This complex is shown here by the colocalization of Ano1 (green), the acting binding signaling protein ezrin (red) and actin (blue) in the apical membranes of acinar and duct cells of the submaxillary gland of mouse. The white strings represent the canalicullar lumen highlighted by the overlapping fluorescent signals. The landmark asterisk in the merged panel is enlarged to the right. Cell diagram depicts a submaxillary secreting cell and its relative position in the acinus. A yellow band on the apical domain marks the localization of ezrin and Ano1. Diagram was modified from Lentz.Citation30 Bar 10 microns.

Figure 3. Flow diagram of the strategy to generate an in vivo membrane protein interactome using SILAC mass spectrometry. See text for details and Perez-Cornejo et al. (2012).Citation1
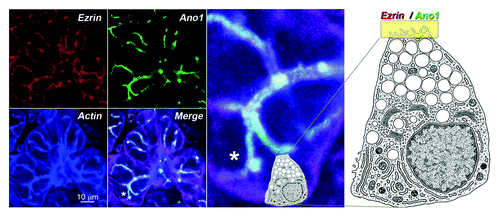
Figure 3. Flow diagram of the strategy to generate an in vivo membrane protein interactome using SILAC mass spectrometry. See text for details and Perez-Cornejo et al. (2012).Citation1