Figures & data
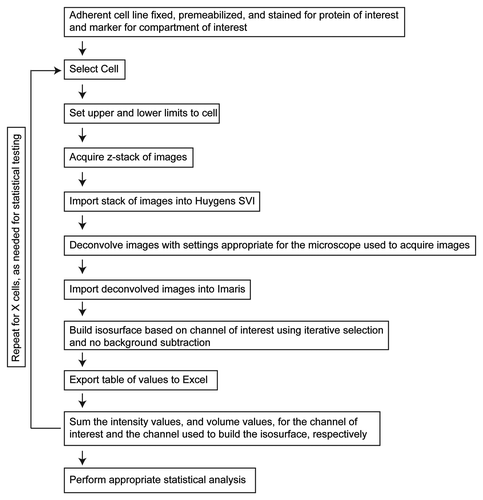
Figure 1. 3D3I Workflow. Steps in the performance of 3D3I to quantify staining in fixed adherent cells in culture are illustrated. We describe throughout the use of one well defined organelle marker (e.g., giantin, TGN46, etc.) to define the isosurface into which the other antigen is compared but any two antigens can be compared in the same way. Wide field images were collected in z-series throughout the volume of the cell to create an image stack. This stack is imported into Huygens SVI software and deconvolved to remove out of focus light. The deconvolved stack is imported into Imaris and an isosurface is built, based upon staining of the organelle marker. An important aspect of this method is that the isosurface is generated without thresholding the stack in any way. Information about the isosurfaces generated by Imaris is then exported to Excel for use. Each object within the isosurface is assigned an identification number with corresponding volumes, sum channel intensities within each object, maximum intensities per object, intensity mean, intensity minimum, standard deviation of intensity and surface areas. This list of exported values is not comprehensive but representative. The return loop is intended to show that the process can be repeated on as many cells as required for the statistical tests used.

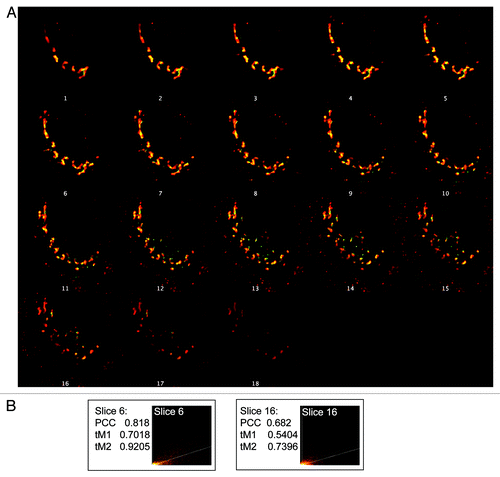
Figure 2. Focal plane bias in use of single images. (A) Stacks of images were collected from HeLaM cells expressing CD8-furin and stained for both CD8 and TGN46, as described under Materials and Methods. Z-stacks (one for each channel) were then deconvolved, the deconvolved stacks opened in ImageJ, merged and a montage created that shows 18 individual images at different depths in the z-plane. (B) Choice of focal plane can affect results of quantification of co-localization. The sixth and the sixteenth slices within the z-stack were arbitrarily selected for co-localization analysis. The two slices were evaluated for PCC, and thresholded Mander’s coefficients (tM1 and tM2) and intensity histograms generated.

Figure 3. Comparison of image segmentation using WatershedCounting3D and 3D3I. The same HeLaM cell, expressing CD8-furin and stained for CD8 and TGN46, shown in was used for analyses. (A) Histogram of intensities from a z-stack of deconvolved images of TGN46 staining; the maximum intensity projection is shown in the inset. (B) The three dimensional surface plot of pixel intensities for TGN46 (red) and CD8 (green) is shown as the merged image. Height indicates relative intensity. (C) WatershedCounting3D was used to identify objects and create a mask based on TGN46 staining. (D) The mask shown in (C) was false-colored blue and imported into the three dimensional intensity plot shown in (B). Blue regions indicate areas contained in the segmented mask. Arrows highlight regions of the mask that occur in areas of low intensity. (E) We used the same deconvolved z-stack of TGN46 (red) staining to generate an isosurface using Imaris (shown in green) as described under Materials and Methods. Isosurface generation results in fewer objects being identified in the regions of low signal intensity [e.g., compare panel (E) to (C)].
![Figure 3. Comparison of image segmentation using WatershedCounting3D and 3D3I. The same HeLaM cell, expressing CD8-furin and stained for CD8 and TGN46, shown in Figure 2 was used for analyses. (A) Histogram of intensities from a z-stack of deconvolved images of TGN46 staining; the maximum intensity projection is shown in the inset. (B) The three dimensional surface plot of pixel intensities for TGN46 (red) and CD8 (green) is shown as the merged image. Height indicates relative intensity. (C) WatershedCounting3D was used to identify objects and create a mask based on TGN46 staining. (D) The mask shown in (C) was false-colored blue and imported into the three dimensional intensity plot shown in (B). Blue regions indicate areas contained in the segmented mask. Arrows highlight regions of the mask that occur in areas of low intensity. (E) We used the same deconvolved z-stack of TGN46 (red) staining to generate an isosurface using Imaris (shown in green) as described under Materials and Methods. Isosurface generation results in fewer objects being identified in the regions of low signal intensity [e.g., compare panel (E) to (C)].](/cms/asset/802d51ac-cdd6-4ae4-b80c-c28cb9f84325/kcll_a_10923150_f0003.gif)
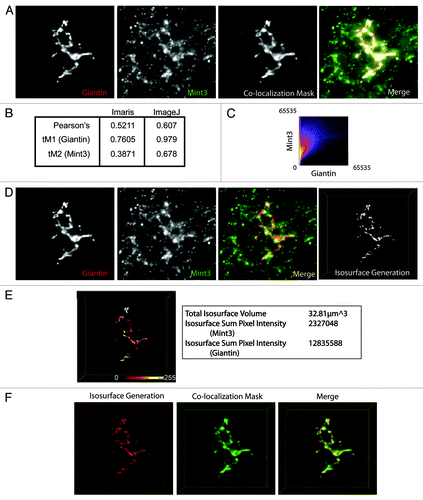
Figure 4. Comparison of 3D3I to other co-localization methods. HeLaM cells were fixed and labeled with antibodies against giantin and Mint3. (A) Images were collected using widefield imaging and a step size of 0.2 μm. Stacks were deconvolved using Huygens deconvolution software (left two panels) and Imaris was used to generate the co-localization mask of the two channels (third panel), as described under Materials and Methods. A merge of the two channels and the colocalization mask are shown (fourth panel). Maximum intensity projections are shown. (B) Pearson’s and thresholded Mander’s (tM) coefficients were calculated using Imaris and ImageJ, as described under Materials and Methods. (C) Imaris was used to generate a scatter plot of pixel intensities using the merged giantin and Mint3 channels shown in (A). (D) The same deconvolved images shown in (A) (left two panels) were opened in Imaris and merged (third panel). The giantin channel (red) was used to create the isosurface (right panel). (E) The isosurface generated in panel (D) is color-coded as a heat map of Mint3 intensities contained within each object in the isosurface. Representative values describing the isosurface are shown in the panel to the right of the color-coded isosurface. Note the variations in Mint3 intensity within the giantin isosurface, based on the color-coding shown. (F) The co-localization mask shown in (A) was falsely-colored green, and the isosurface generated in (D) was falsely-colored red. The two are displayed simultaneously in the merged image. The isosurface is a more tightly defined volume as the two representations overlap, but the co-localization mask highlights regions not identified by the isosurface.

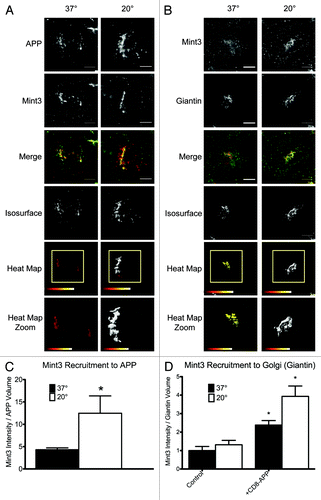
Figure 5. Example of a 3D3I application. Temperature block increases the recruitment of Mint3 to APP at the Golgi. HeLaM cells were transfected with empty plasmid or ones directing expression of full length human APP (A), (B) or CD8-APP (D) and the next day were fixed with or without imposition of the temperature blockade, as described under Materials and Methods. Cells were then stained for (A) APP and Mint3 or (B) Mint3 and giantin. Maximum intensity projections of widefield images are shown with isosurface generation using APP (A) or giantin (B) staining. Heat maps indicate the intensity of Mint3 staining within those isosurfaces. (C) The amount of Mint3 staining per APP volume was determined under the conditions shown in panel (A). (D) Control HeLaM cells, or cells expressing CD8-APP were maintained 37°C or temperature blocked prior to fixation, and stained with antibodies directed against Mint3 or CD8. Bars in (C and D) show the average from n ≥ 7 cells per condition, representative of at least three independent experiments. Error bars indicate standard error of the mean (SEM). Asterisks indicate a p < 0.01, each compared with control, steady-state staining.
