721
Views
18
CrossRef citations to date
0
Altmetric
Report

Vitamin D and calcium status in urban children attending an ambulatory clinic service in the United Arab Emirates

, &
Pages 39-43 | Received 19 Sep 2011, Accepted 27 Sep 2011, Published online: 01 Jan 2012

Figures & data

Table 1. Summary statistics of biochemical parameters (the values quoted are the reference ranges*; mean ± SD ** and the percent of children with abnormal values***)

Figure 1. Relationship between 25-OH D and age.

Figure 1. Relationship between 25-OH D and age.

Figure 2. Cumulative frequency graph showing the vitamin D status in both sexes according to four age groups.
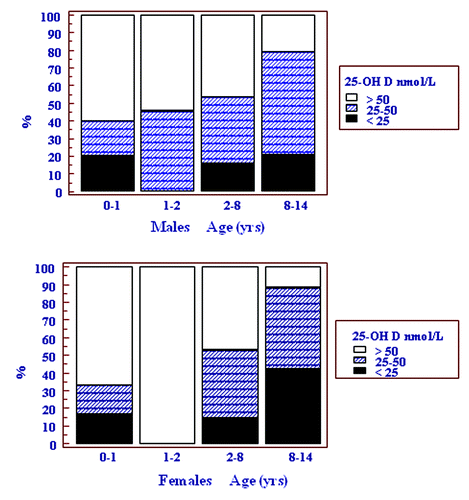
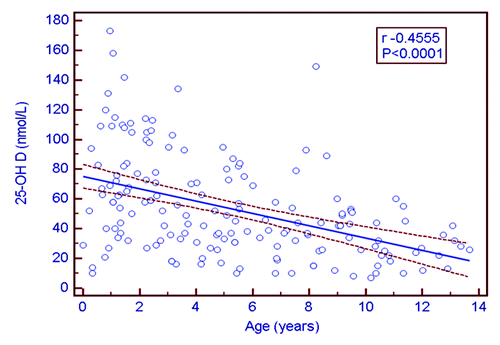
Figure 2. Cumulative frequency graph showing the vitamin D status in both sexes according to four age groups.
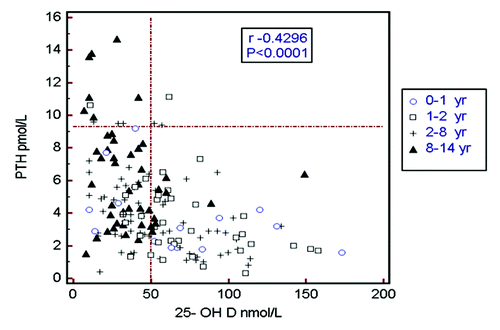
Figure 3. Relationship between PTH and 25-OHD concentrations according to four different age groups.

Figure 3. Relationship between PTH and 25-OHD concentrations according to four different age groups.

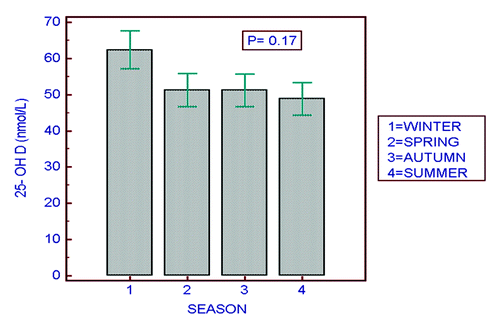
Figure 4. Seasonal variation in vitamin D status. Bars depict one standard error of the mean.

Figure 4. Seasonal variation in vitamin D status. Bars depict one standard error of the mean.