1,750
Views
8
CrossRef citations to date
0
Altmetric
Report

When are laboratory tests indicated in patients with vitiligo?

, , , , , & show all
Pages 53-57 | Received 29 Oct 2011, Accepted 15 Dec 2011, Published online: 01 Jan 2012

Figures & data

Table 1. More frequently associated diseases in our vitiligo patients (n = 196)

Table 2. clinical subtypes of vitiligo in the sample

Table 3. Clinical and analytical differences between segmental/non segmental subtypes

Figure 1. Frequency of serologic altered values in patients (n = 196) and controls (n = 160). Comparison of serologic alterations between patient and control groups (p values are shown in the table at the top of the bars; asterisks are shown when values are < 0.05).
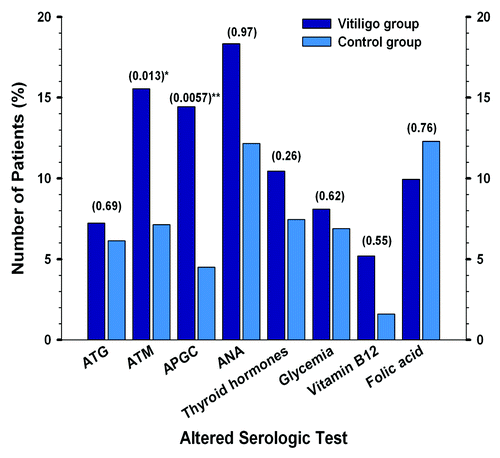
Figure 1. Frequency of serologic altered values in patients (n = 196) and controls (n = 160). Comparison of serologic alterations between patient and control groups (p values are shown in the table at the top of the bars; asterisks are shown when values are < 0.05).

Figure 2. Frequency of altered parameters in case (n = 196) and control group (n = 160) compared by sex. Statistically significant p values (< 0,05) are shown with asterisk at the top of the bars: ATM and APGC levels between women belonging to vitiligo or control group showed significant differences (*p = 0,014, **p = 0.002 respectively).
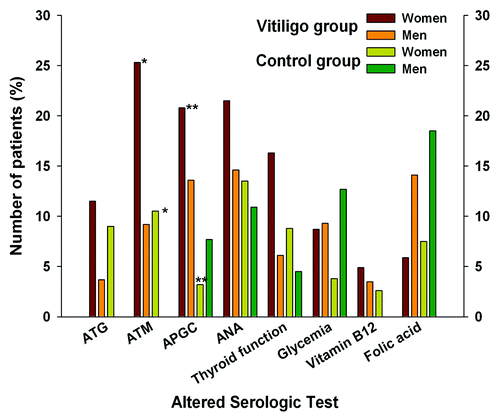
Figure 2. Frequency of altered parameters in case (n = 196) and control group (n = 160) compared by sex. Statistically significant p values (< 0,05) are shown with asterisk at the top of the bars: ATM and APGC levels between women belonging to vitiligo or control group showed significant differences (*p = 0,014, **p = 0.002 respectively).