Figures & data
Figure 1. Correlation coefficient of serum 25(OH)D concentration measured in two periods vs. follow-up period.
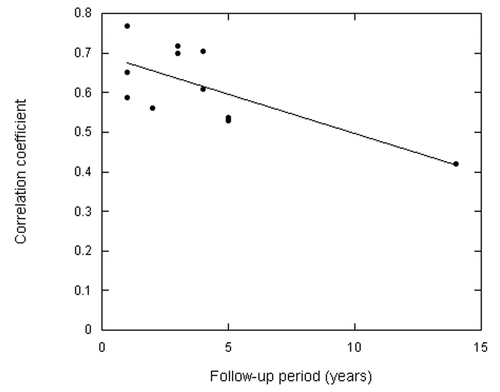
Figure 2. Hazard ratios (HRs) for all-cause mortality rate per 20-nmol/l increase in serum 25(OH)D concentration, using data from Figure 3 in Schöttker et al.Citation13 vs. follow-up period. The equations for the regression fits are: HR = 0.72 + 0.017 t; HR [lower confidence interval (CI) = 0.50 + 0.029 t]; HR (upper CI) = 1.03 – 0.0009 t, where t = time (years).
![Figure 2. Hazard ratios (HRs) for all-cause mortality rate per 20-nmol/l increase in serum 25(OH)D concentration, using data from Figure 3 in Schöttker et al.Citation13 vs. follow-up period. The equations for the regression fits are: HR = 0.72 + 0.017 t; HR [lower confidence interval (CI) = 0.50 + 0.029 t]; HR (upper CI) = 1.03 – 0.0009 t, where t = time (years).](/cms/asset/176573ab-fc76-4bf8-9709-ef07509be95c/kder_a_10920514_f0002.gif)