Figures & data
Table 1. Overview of Studies on 25(OH) D Values in Adults in Middle East and North Africa
Table 2. Overview of studies on 25(OH) D values in Children in Middle East
Table 3. Overview of Studies on 25(OH) D Values in Pregnant Women/Neonates in Middle East
Figure 1. Serum 25(OH)D Levels in Adults (A) and Children (B) Based on Color Codes. The color codes are: green > 30 ng/ml, yellow 20–29 ng/ml, orange 10–19 ng/ml, and red < 10 ng/ml. To convert from ng/ml to nmol multiply by 2.5. The color codes were selected based on mean or median results from population based studies available or as obtained from most representative studies for each country. For countries with varying results, the color code was chosen as valid for ≥ 50% of reported values; or more than one color code was used (for, e.g., children in Iran).
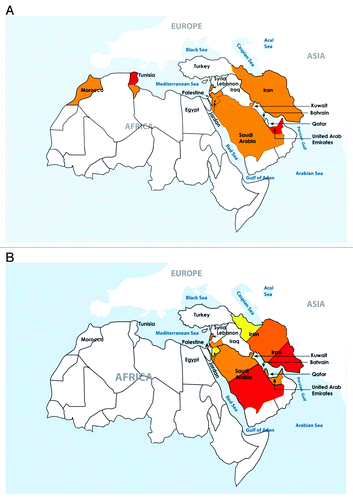
Table 4. Overview on Association Studies Between 25(OH) D Levels and Health Outcomes in the Middle East and North Africa
Table 5. Overview on Interventional Studies between 25(OH)D Levels and Health Outcomes in the Middle East
Supplemental material