1,173
Views
62
CrossRef citations to date
0
Altmetric
Research Paper

Different measures of “genome-wide” DNA methylation exhibit unique properties in placental and somatic tissues

, , , , &
Pages 652-663 | Published online: 01 Jun 2012

Figures & data

Figure 1. Schematic of analyses performed.

Figure 1. Schematic of analyses performed.

Figure 2. The assessment of Alu and L1 DNA methylation is affected by evolutionary age and assay type. DNA methylation of (A) Alu and (B) L1 was assessed in two groups: merged villi (n = 31; 1st trimester, 2nd trimester and term villi) and merged somatic tissues (n = 39; brain, kidney, muscle, blood) using Pyrosequencing and probes from the Illumina Infinium HumanMethylation27 BeadChip array. Array probes that mapped to REs were divided into three age groups based on evolutionary emergence: old Alu (AluJ; n = 113), intermediate Alu (AluS; n = 272), young Alu (AluY; n = 58) and old L1 (L1M; n = 24), intermediate L1 (L1P; n = 160), young L1 (L1H; n = 4). There was a trend for increased DNA methylation from the old to young Alu and L1 measured by the array. Alu and L1 DNA methylation as assessed by Pyrosequencing was significantly different from each age group measured by the array, except when comparing L1 by Pyrosequencing to young L1s in the merged villi group. Significance is indicated by *p < 0.05, **p < 0.001, ***p < 0.0001
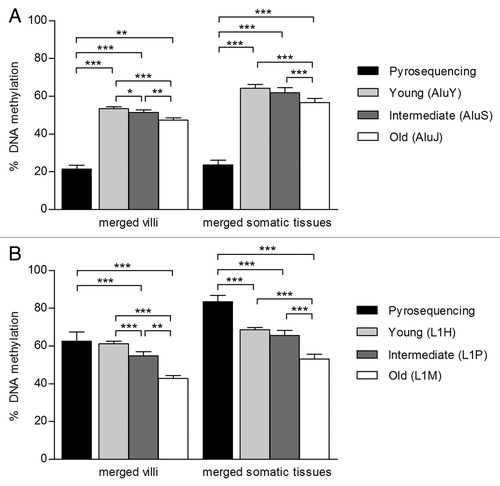
Figure 2. The assessment of Alu and L1 DNA methylation is affected by evolutionary age and assay type. DNA methylation of (A) Alu and (B) L1 was assessed in two groups: merged villi (n = 31; 1st trimester, 2nd trimester and term villi) and merged somatic tissues (n = 39; brain, kidney, muscle, blood) using Pyrosequencing and probes from the Illumina Infinium HumanMethylation27 BeadChip array. Array probes that mapped to REs were divided into three age groups based on evolutionary emergence: old Alu (AluJ; n = 113), intermediate Alu (AluS; n = 272), young Alu (AluY; n = 58) and old L1 (L1M; n = 24), intermediate L1 (L1P; n = 160), young L1 (L1H; n = 4). There was a trend for increased DNA methylation from the old to young Alu and L1 measured by the array. Alu and L1 DNA methylation as assessed by Pyrosequencing was significantly different from each age group measured by the array, except when comparing L1 by Pyrosequencing to young L1s in the merged villi group. Significance is indicated by *p < 0.05, **p < 0.001, ***p < 0.0001

Table 1. Spearman correlation of DNA methylation at five ReDS

Figure 3. Five ReDS exhibit different tissue patterns of DNA methylation. DNA methylation in villi (n = 11), brain (n = 8), kidney (n = 11) and muscle (n = 10) from 2nd trimester fetuses and adult blood (n = 10) was measured using (A) % Alu, (B) % L1, (C) strong island probes, (D) weak island probes and (E) non-island probes. L1, weak island and non-island probe methylation were most variable tissue to tissue. Villi DNA methylation was significantly reduced compared with most other somatic tissues at L1, weak island and non-island probes. However villi DNA methylation was significantly increased compared with kidney and muscle at strong island probes. Significance is indicated by *p < 0.05, **p < 0.001, ***p < 0.0001.
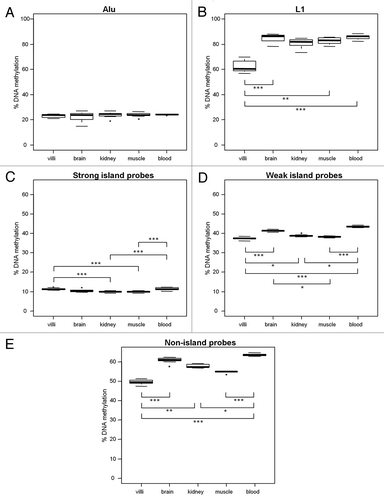
Figure 3. Five ReDS exhibit different tissue patterns of DNA methylation. DNA methylation in villi (n = 11), brain (n = 8), kidney (n = 11) and muscle (n = 10) from 2nd trimester fetuses and adult blood (n = 10) was measured using (A) % Alu, (B) % L1, (C) strong island probes, (D) weak island probes and (E) non-island probes. L1, weak island and non-island probe methylation were most variable tissue to tissue. Villi DNA methylation was significantly reduced compared with most other somatic tissues at L1, weak island and non-island probes. However villi DNA methylation was significantly increased compared with kidney and muscle at strong island probes. Significance is indicated by *p < 0.05, **p < 0.001, ***p < 0.0001.

Figure 4. Distance to transcription start site (TSS) influences methylation of probes in promoters. 98% of probes on the Illumina Infinium HumanMethylation27 BeadChip array were within 1500 bps of a known gene TSS. (A) In the merged villi group, DNA methylation was analyzed by binning probes into six 500 bp windows around known TSS. There were significant differences in DNA methylation between probes in strong (●) weak (■) and non(▲) islands (p<0.0001) but direction to TSS had no significant effect on DNA methylation. DNA methylation of probes furthest from TSS (± 1000 to 1500 bps; 16.31% ± 2.26, 59.29% ± 5.39, 63.82% ± 3.6 for strong, weak and non islands respectively) was significantly higher than probes close to TSS (± 0 to 500 bps; 8.65% ± 0.77; 35.60% ± 2.16, 57.14 ± 3.33 for strong, weak and non island respectively, all p<0.001). Tissue differences in DNA methylation of 2nd trimester villi, muscle, kidney, brain and adult blood were investigated in three TSS bins in strong CpG islands: (B) ± 0 to 500 bps, (C) ± 501 to 1000 bps and (D) ± 1000 to 1500 bps. Significance is indicated by *p < 0.05, **p < 0.001, ***p < 0.0001.
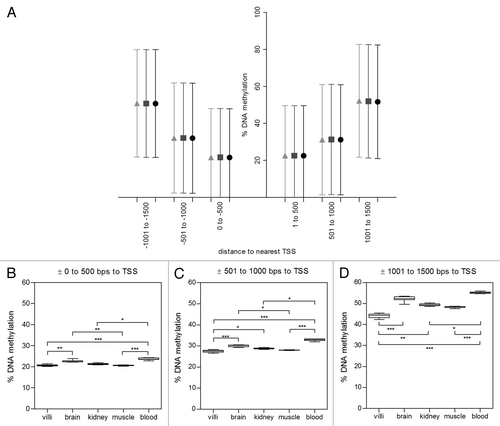
Figure 4. Distance to transcription start site (TSS) influences methylation of probes in promoters. 98% of probes on the Illumina Infinium HumanMethylation27 BeadChip array were within 1500 bps of a known gene TSS. (A) In the merged villi group, DNA methylation was analyzed by binning probes into six 500 bp windows around known TSS. There were significant differences in DNA methylation between probes in strong (●) weak (■) and non(▲) islands (p<0.0001) but direction to TSS had no significant effect on DNA methylation. DNA methylation of probes furthest from TSS (± 1000 to 1500 bps; 16.31% ± 2.26, 59.29% ± 5.39, 63.82% ± 3.6 for strong, weak and non islands respectively) was significantly higher than probes close to TSS (± 0 to 500 bps; 8.65% ± 0.77; 35.60% ± 2.16, 57.14 ± 3.33 for strong, weak and non island respectively, all p<0.001). Tissue differences in DNA methylation of 2nd trimester villi, muscle, kidney, brain and adult blood were investigated in three TSS bins in strong CpG islands: (B) ± 0 to 500 bps, (C) ± 501 to 1000 bps and (D) ± 1000 to 1500 bps. Significance is indicated by *p < 0.05, **p < 0.001, ***p < 0.0001.

Figure 5. Increase in DNA methylation at weak and non-islands throughout gestation. DNA methylation in 1st trimester (n = 10), 2nd trimester (n = 11) and term (n = 10) placental villi was measured with (A) % Alu, (B) % L1, (C) strong island probes, (D) weak island probes and (E) non-island probes. There was no change in L1 or strong island methylation, but a notable increase in methylation at weak and non-islands throughout gestation. Significance is indicated by *p < 0.05, **p < 0.001, ***p < 0.0001.
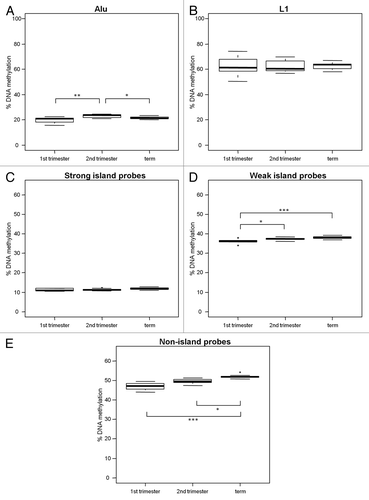
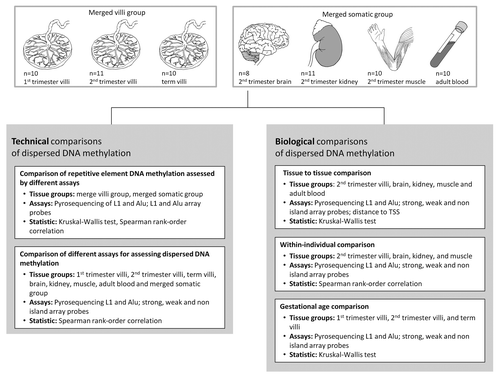
Figure 5. Increase in DNA methylation at weak and non-islands throughout gestation. DNA methylation in 1st trimester (n = 10), 2nd trimester (n = 11) and term (n = 10) placental villi was measured with (A) % Alu, (B) % L1, (C) strong island probes, (D) weak island probes and (E) non-island probes. There was no change in L1 or strong island methylation, but a notable increase in methylation at weak and non-islands throughout gestation. Significance is indicated by *p < 0.05, **p < 0.001, ***p < 0.0001.
Supplemental material

Additional material

Download Zip (2.4 MB)