1,178
Views
41
CrossRef citations to date
0
Altmetric
Research Paper

DNA methylation analyses of urothelial carcinoma reveal distinct epigenetic subtypes and an association between gene copy number and methylation status

, , , , , , , , , , , , & show all
Pages 858-867 | Published online: 18 Jun 2012

Figures & data

Figure 1. Hypo- and hypermethylated CpGs in tumors. Hypomethylation, blue; hypermethylation, yellow. Vertical blue and yellow lines indicate median CpG density of hypo- and hypermethylated CpGs, respectively. X-axis, CpG density defined as fraction of CpGs in a 1600 bp window. Y-axis, difference in β-value between tumor and normal tissue.
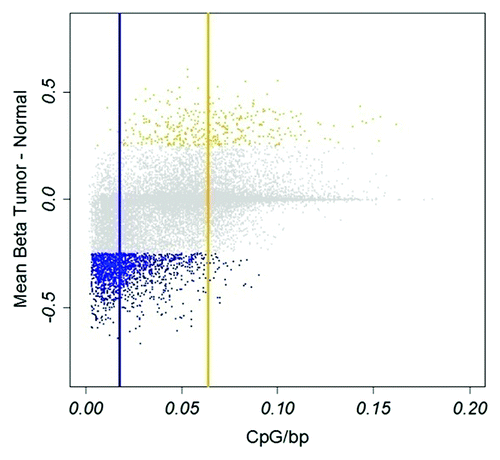
Figure 1. Hypo- and hypermethylated CpGs in tumors. Hypomethylation, blue; hypermethylation, yellow. Vertical blue and yellow lines indicate median CpG density of hypo- and hypermethylated CpGs, respectively. X-axis, CpG density defined as fraction of CpGs in a 1600 bp window. Y-axis, difference in β-value between tumor and normal tissue.

Table 1. Enriched TF motifs covering CpGs with positive correlation to gene expression

Figure 2. Transcription factor binding motifs contain CpGs that show a positive association between methylation and gene expression levels. UCSC genome browser view of MYCMAX_01/02 and CREBP1_01/Q2 transcription factor motifs. Each panel contains the following tracks from top to bottom: Coordinates of human hg18 genome. CpGs present on Illumina’s 27K platform. Transcription factor motifs, red. RefSeq genes, blue.
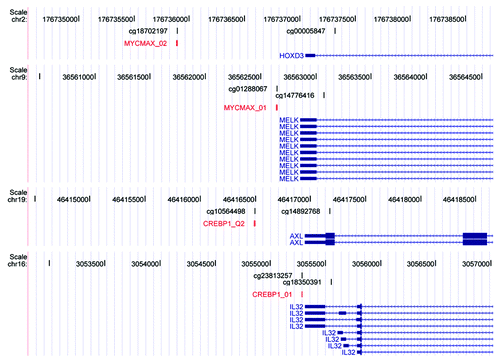
Figure 2. Transcription factor binding motifs contain CpGs that show a positive association between methylation and gene expression levels. UCSC genome browser view of MYCMAX_01/02 and CREBP1_01/Q2 transcription factor motifs. Each panel contains the following tracks from top to bottom: Coordinates of human hg18 genome. CpGs present on Illumina’s 27K platform. Transcription factor motifs, red. RefSeq genes, blue.

Figure 3. Methylation of CpG sites is associated to copy number levels. (A) Methylation in cases with gains. RASSF1 (two CpGs), ZMYND10, MSX1, TERT, and HOXB4 CpG sites show methylation in samples with gains. X-axis, DNA methylation as β-values. Y-axis, log-ratio of copy number. Solid horizontal line, copy number = 2; red points, cases with gains; black points, cases with normal copy number or losses. (B) Demethylation in cases with gains at KRT20 site. Lower plot, expression is increased in cases that show demethylation and gains; dashed line shows correlation of expression and methylation levels. (C) Effect of copy number on gene expression stratified by CpGs that are uncorrelated in cases with gains, methylated in cases with gains, and de-methylated in cases with gains. Y-axis, correlation of copy number and gene expression. P value from t-test.
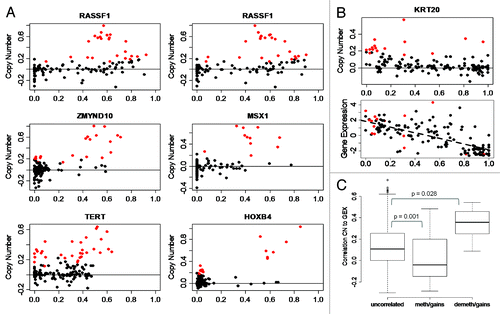
Figure 3. Methylation of CpG sites is associated to copy number levels. (A) Methylation in cases with gains. RASSF1 (two CpGs), ZMYND10, MSX1, TERT, and HOXB4 CpG sites show methylation in samples with gains. X-axis, DNA methylation as β-values. Y-axis, log-ratio of copy number. Solid horizontal line, copy number = 2; red points, cases with gains; black points, cases with normal copy number or losses. (B) Demethylation in cases with gains at KRT20 site. Lower plot, expression is increased in cases that show demethylation and gains; dashed line shows correlation of expression and methylation levels. (C) Effect of copy number on gene expression stratified by CpGs that are uncorrelated in cases with gains, methylated in cases with gains, and de-methylated in cases with gains. Y-axis, correlation of copy number and gene expression. P value from t-test.

Figure 4. Epitypes in their genomic and histopathologcial context. (A) Heat map of 25% most varying CpGs. Left bar, green, Island CpGs; gray, non-Island CpGs. Heat map color code, blue, low methylation levels to yellow, high methylation levels. Epitypes as noted in the upper bar. Tumors within an Epitype are ordered by molecular subtype (MS types). N, normal urothelium. (B) Patient information and molecular annotations. MS types, green, MS1; red, MS2. Age is colored from young age, green to old age, red. Gender, pink, female; blue, male. Histological stage, green, Ta; blue, T1; red, T2 or higher. Histological grade, green, Grade1; blue, Grade2; red, Grade3. FGFR3, TP53, and PIK3CA mutations, gray, not mutated; black, mutated. No. FGA (Number of focal genomic amplifications) is the number of continuous stretches with more than 5 gained CpGs, light green, 0–4 gains; dark green, 5–8 gains; orange, 9–12 gains; red, more than 12 gains. 9q losses of more than 1x SAT are indicated in dark green and of more than 2.5xSAT in light green. The 6p amplicon ranges from E2F3 to SOX4; with gains more than 1xSAT in orange and more than 2.5xSAT in red. (C) EZH2 mRNA and protein expression (IHC), MBD2 mRNA expression, as well as mean methylation levels of PRC2 target genes, HOX genes and genes with GO term ‘Developmental processes’. Data has been partitioned in ten quantiles and color is in ten colors from pink, low expression/methylation to black, high expression/methylation.
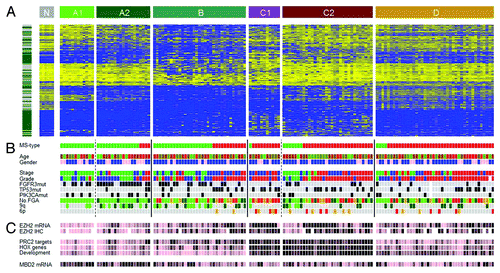
Figure 4. Epitypes in their genomic and histopathologcial context. (A) Heat map of 25% most varying CpGs. Left bar, green, Island CpGs; gray, non-Island CpGs. Heat map color code, blue, low methylation levels to yellow, high methylation levels. Epitypes as noted in the upper bar. Tumors within an Epitype are ordered by molecular subtype (MS types). N, normal urothelium. (B) Patient information and molecular annotations. MS types, green, MS1; red, MS2. Age is colored from young age, green to old age, red. Gender, pink, female; blue, male. Histological stage, green, Ta; blue, T1; red, T2 or higher. Histological grade, green, Grade1; blue, Grade2; red, Grade3. FGFR3, TP53, and PIK3CA mutations, gray, not mutated; black, mutated. No. FGA (Number of focal genomic amplifications) is the number of continuous stretches with more than 5 gained CpGs, light green, 0–4 gains; dark green, 5–8 gains; orange, 9–12 gains; red, more than 12 gains. 9q losses of more than 1x SAT are indicated in dark green and of more than 2.5xSAT in light green. The 6p amplicon ranges from E2F3 to SOX4; with gains more than 1xSAT in orange and more than 2.5xSAT in red. (C) EZH2 mRNA and protein expression (IHC), MBD2 mRNA expression, as well as mean methylation levels of PRC2 target genes, HOX genes and genes with GO term ‘Developmental processes’. Data has been partitioned in ten quantiles and color is in ten colors from pink, low expression/methylation to black, high expression/methylation.

Figure 5. MDS analysis. A two-dimensional MDS representation of the similarities among tumors. Green, Epitype A samples; blue, Epitype B samples; red, Epitype C samples; black, normal urothelium. Epitype D samples were omitted from the analysis.
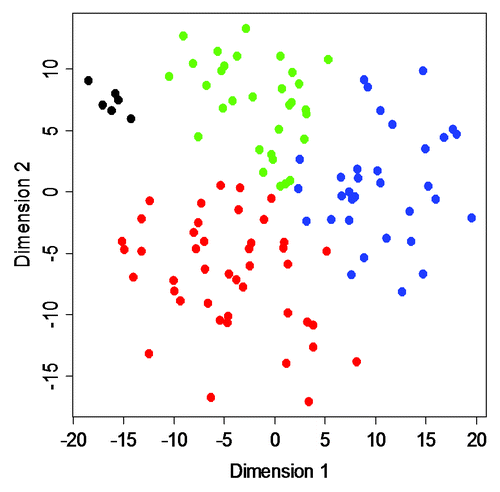
Figure 5. MDS analysis. A two-dimensional MDS representation of the similarities among tumors. Green, Epitype A samples; blue, Epitype B samples; red, Epitype C samples; black, normal urothelium. Epitype D samples were omitted from the analysis.
Supplemental material

Additional material

Download Zip (4.9 MB)