2,396
Views
17
CrossRef citations to date
0
Altmetric
Research Paper

Methods for the analysis of histone H3 and H4 acetylation in blood

, , &
Pages 875-882 | Published online: 09 Jul 2012

Figures & data

Figure 1. Western blot showing histone H3 and H4 acetylation in leukocytes separated by (A) Ficoll-Paque PLUS, or (B) red cell lysis. 20µg of protein was loaded in each lane of 15% SDS-PAGE gels. Rabbit anti-acetyl histone H3 detected a protein band at approximately 16 KDa and rabbit anti-acetyl histone H4 detected a band at 12KDa; mouse anti-β actin (the loading control) recognized a protein band at 42 KDa. The secondary antibody anti-mouse Cy3 has red fluorescence and the anti-rabbit Cy5 has green fluorescence. Lane 1, size marker. Lane 2, pre-treatment leukocytes separated by Ficoll-Paque or red cell lysis. Lane 3, 0.1% DMSO treated for 24 h. Lane 4, 100 nM LBH589 treated for 24 h. Lane 5, DMSO treated post-separation from leukocyte-depleted blood. Lane 6, LBH589 treated post-separation from leukocyte-depleted blood. Lane 7; Control 697 cells incubated with 100 nM LBH589 for 24 h.
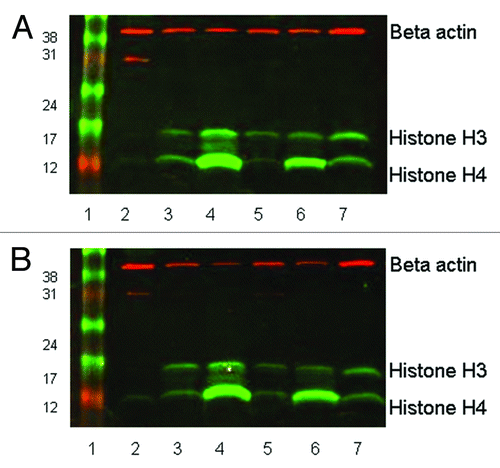
Figure 1. Western blot showing histone H3 and H4 acetylation in leukocytes separated by (A) Ficoll-Paque PLUS, or (B) red cell lysis. 20µg of protein was loaded in each lane of 15% SDS-PAGE gels. Rabbit anti-acetyl histone H3 detected a protein band at approximately 16 KDa and rabbit anti-acetyl histone H4 detected a band at 12KDa; mouse anti-β actin (the loading control) recognized a protein band at 42 KDa. The secondary antibody anti-mouse Cy3 has red fluorescence and the anti-rabbit Cy5 has green fluorescence. Lane 1, size marker. Lane 2, pre-treatment leukocytes separated by Ficoll-Paque or red cell lysis. Lane 3, 0.1% DMSO treated for 24 h. Lane 4, 100 nM LBH589 treated for 24 h. Lane 5, DMSO treated post-separation from leukocyte-depleted blood. Lane 6, LBH589 treated post-separation from leukocyte-depleted blood. Lane 7; Control 697 cells incubated with 100 nM LBH589 for 24 h.

Figure 2. Quantitative analysis of acetylation from western blotting. Bands representing acetylated histone were adjusted for β-actin intensity and normalized to those of the positive control, LBH589-treated 697 leukemia cells. Data are shown for anti-acetylated histone H3 and H4 on cells extracted by (A) Ficoll-Paque PLUS and (B) red cell lysis. Day 0 indicates the pre-treatment sample. Lanes labeled as 1st extraction represent post-incubation leukocytes treated with 100 nM LBH589 for 24 h and 2nd extraction represent leukocytes treated with LBH589 for 24 h and then re-separated from leukocyte depleted blood
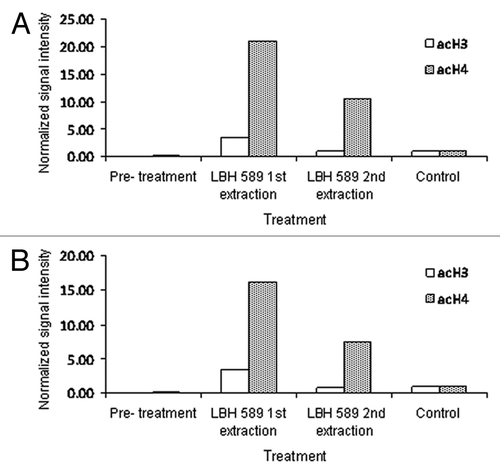
Figure 2. Quantitative analysis of acetylation from western blotting. Bands representing acetylated histone were adjusted for β-actin intensity and normalized to those of the positive control, LBH589-treated 697 leukemia cells. Data are shown for anti-acetylated histone H3 and H4 on cells extracted by (A) Ficoll-Paque PLUS and (B) red cell lysis. Day 0 indicates the pre-treatment sample. Lanes labeled as 1st extraction represent post-incubation leukocytes treated with 100 nM LBH589 for 24 h and 2nd extraction represent leukocytes treated with LBH589 for 24 h and then re-separated from leukocyte depleted blood

Figure 3. Percentage of live leukocytes in cord (squares) and peripheral blood (triangles) serially isolated over four days. Error bars represent the standard error from triplicate analyses.
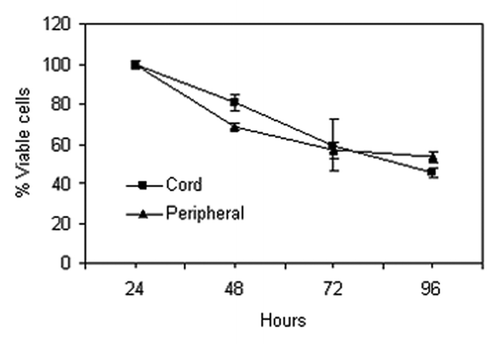
Figure 3. Percentage of live leukocytes in cord (squares) and peripheral blood (triangles) serially isolated over four days. Error bars represent the standard error from triplicate analyses.

Figure 4. Immunohistochemistry. Histone acetylation in leukocytes was detected with rabbit anti-acetylated histone H3 and histone H4 antibodies with anti-rabbit Alexa Fluor 488 as the secondary antibody. Cells were counterstained with the nuclear DNA intercalating dye, DAPI. The upper panel of cells shows the merge of the green Alexa Fluor 488 acetylated histone staining with the blue nuclear DAPI stain, and the lower panels, acetylated histone staining alone. Histone H3 acetylation is less intense and localized to the periphery of the nucleus whereas Histone H4 acetylation is more intense and concentrated within the nucleus.
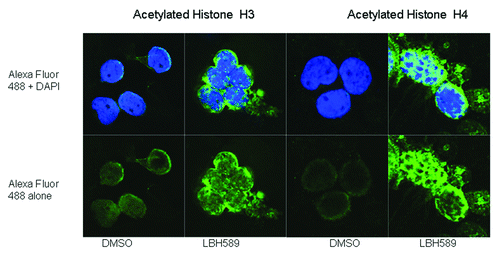
Figure 4. Immunohistochemistry. Histone acetylation in leukocytes was detected with rabbit anti-acetylated histone H3 and histone H4 antibodies with anti-rabbit Alexa Fluor 488 as the secondary antibody. Cells were counterstained with the nuclear DNA intercalating dye, DAPI. The upper panel of cells shows the merge of the green Alexa Fluor 488 acetylated histone staining with the blue nuclear DAPI stain, and the lower panels, acetylated histone staining alone. Histone H3 acetylation is less intense and localized to the periphery of the nucleus whereas Histone H4 acetylation is more intense and concentrated within the nucleus.

Figure 5. Analysis of histone acetylation by flow cytometry. Mean fluorescence values obtained from triplicate data sets of both median and mean fluorescence calculations for acetylated histone H3 or histone H4, obtained from flow cytometry. Standard error of the statistical mean is indicated by the error bars. The y-axis shows the relative fluorescence intensity. DMSO diluent data were histogram subtracted from that of cells incubated with 100 nM LBH589 and stored for the designated times. Cells were fixed post-separation of the buffy coat (pre-treatment), 24 h after DMSO or LBH589 incubation (0 time), and thereafter at 24, 48, 72 and 96 h storage at 4°C, 20°C or 37°C. The fixed cells were stained for histone H3 and histone H4 acetylation and analyzed by flow cytometry. 697 cells incubated with LBH589 for 24 h were included as controls. White bars represent histone acetylation data after incubation at 4°C, gray bars 20°C and black bars 37°C.
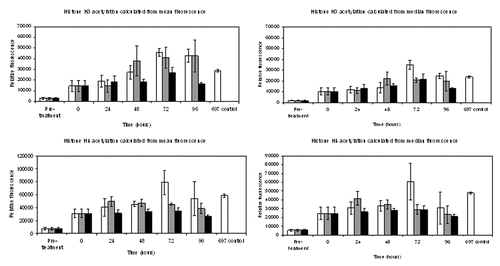
Figure 5. Analysis of histone acetylation by flow cytometry. Mean fluorescence values obtained from triplicate data sets of both median and mean fluorescence calculations for acetylated histone H3 or histone H4, obtained from flow cytometry. Standard error of the statistical mean is indicated by the error bars. The y-axis shows the relative fluorescence intensity. DMSO diluent data were histogram subtracted from that of cells incubated with 100 nM LBH589 and stored for the designated times. Cells were fixed post-separation of the buffy coat (pre-treatment), 24 h after DMSO or LBH589 incubation (0 time), and thereafter at 24, 48, 72 and 96 h storage at 4°C, 20°C or 37°C. The fixed cells were stained for histone H3 and histone H4 acetylation and analyzed by flow cytometry. 697 cells incubated with LBH589 for 24 h were included as controls. White bars represent histone acetylation data after incubation at 4°C, gray bars 20°C and black bars 37°C.

Figure 6. Analysis of in vivo leukocyte histone acetylation by flow cytometry. Mean and median fluorescence values for histone H3 and histone H4 acetylation in four sets of leukocytes over a treatment course, obtained by flow cytometry. The standard error of the statistical mean is indicated by the error bars. The y-axis shows the relative fluorescence intensity. Pre-treatment patient data were histogram subtracted from that of cells collected 6, 24 and 48 h post a single 30 min infusion of 15 mg/m2 LBH589. Cells were fixed post-separation from blood by red cell lysis. The fixed cells were stained for histone H3 and histone H4 acetylation and analyzed by flow cytometry
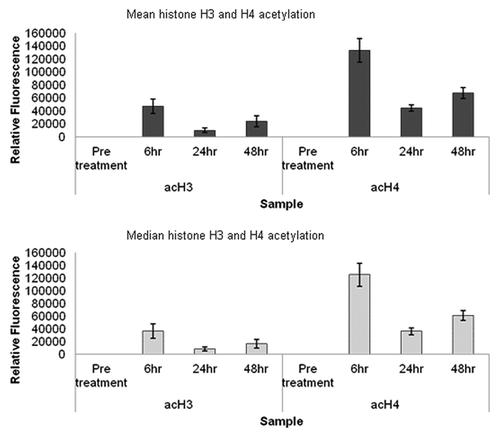
Figure 6. Analysis of in vivo leukocyte histone acetylation by flow cytometry. Mean and median fluorescence values for histone H3 and histone H4 acetylation in four sets of leukocytes over a treatment course, obtained by flow cytometry. The standard error of the statistical mean is indicated by the error bars. The y-axis shows the relative fluorescence intensity. Pre-treatment patient data were histogram subtracted from that of cells collected 6, 24 and 48 h post a single 30 min infusion of 15 mg/m2 LBH589. Cells were fixed post-separation from blood by red cell lysis. The fixed cells were stained for histone H3 and histone H4 acetylation and analyzed by flow cytometry

Figure 7. western blot showing histone H3 and H4 acetylation in vivo in leukocytes from a single patient. Twenty micrograms of protein was loaded in each lane of a 15% SDS-PAGE gel. Rabbit anti-acetyl histone H3 detected a protein band at approximately 16 KDa and rabbit anti-acetyl histone H4 detected a band at 12 KDa; mouse anti-β-actin (the loading control) recognized a protein band at 42 KDa. The secondary antibody anti-mouse Cy3 has red fluorescence and the anti-rabbit Cy5 has green fluorescence. Lane 1, size marker. Lane 2, pre-treatment leukocytes. Lane 3, 6 h post treatment. Lane 4, 24 h post treatment. Lane 5, 48 h post treatment. Lane 6, control 697 cells incubated with 100 nM LBH589 for 24 h.
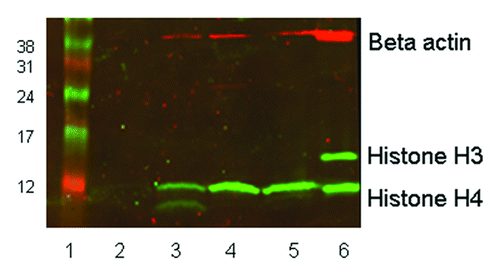
Figure 7. western blot showing histone H3 and H4 acetylation in vivo in leukocytes from a single patient. Twenty micrograms of protein was loaded in each lane of a 15% SDS-PAGE gel. Rabbit anti-acetyl histone H3 detected a protein band at approximately 16 KDa and rabbit anti-acetyl histone H4 detected a band at 12 KDa; mouse anti-β-actin (the loading control) recognized a protein band at 42 KDa. The secondary antibody anti-mouse Cy3 has red fluorescence and the anti-rabbit Cy5 has green fluorescence. Lane 1, size marker. Lane 2, pre-treatment leukocytes. Lane 3, 6 h post treatment. Lane 4, 24 h post treatment. Lane 5, 48 h post treatment. Lane 6, control 697 cells incubated with 100 nM LBH589 for 24 h.

Reprints and Corporate Permissions

Please note: Selecting permissions does not provide access to the full text of the article, please see our help page How do I view content?

To request a reprint or corporate permissions for this article, please click on the relevant link below:

Academic Permissions

Please note: Selecting permissions does not provide access to the full text of the article, please see our help page How do I view content?

Obtain permissions instantly via Rightslink by clicking on the button below:

If you are unable to obtain permissions via Rightslink, please complete and submit this Permissions form. For more information, please visit our Permissions help page.