2,148
Views
28
CrossRef citations to date
0
Altmetric
Research Paper

Hepatic ontogeny and tissue distribution of mRNAs of epigenetic modifiers in mice using RNA-sequencing

, , , , &
Pages 914-929 | Published online: 09 Jul 2012

Figures & data

Figure 1. Hepatic ontogeny (A) and tissue distribution (B) of mRNAs of genes involved in DNA methylation and demethylation in male C57BL/6 mice. (A) Liver from C57BL/6 mice of ages from Day 2 to Day 60. n = 3, mean ± SE. Y-axis represents mRNAs expressed as fragments per kilobase of exon per million reads mapped (FPKM). (B) Liver, kidney, and small intestine from C57BL/6 mice of 60 d old. n = 2, mean ± SE. Y-axis represents relative mRNA expression with values of liver set as 1.0.
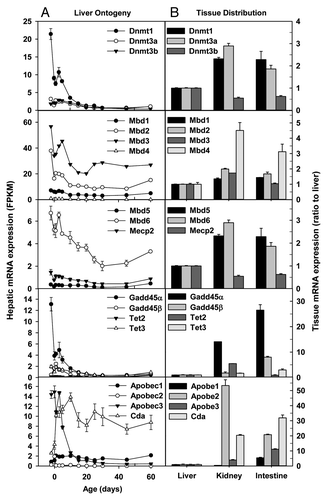
Figure 1. Hepatic ontogeny (A) and tissue distribution (B) of mRNAs of genes involved in DNA methylation and demethylation in male C57BL/6 mice. (A) Liver from C57BL/6 mice of ages from Day 2 to Day 60. n = 3, mean ± SE. Y-axis represents mRNAs expressed as fragments per kilobase of exon per million reads mapped (FPKM). (B) Liver, kidney, and small intestine from C57BL/6 mice of 60 d old. n = 2, mean ± SE. Y-axis represents relative mRNA expression with values of liver set as 1.0.
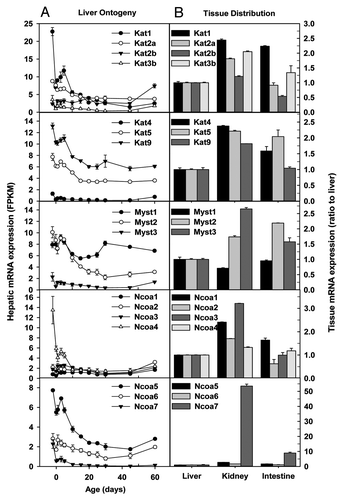
Figure 2. Hepatic ontogeny (A) and tissue distribution (B) of mRNAs of genes involved in histone acetylation in male C57BL/6 mice. (A) Liver from C57BL/6 mice of ages from Day 2 to Day 60. n = 3, mean ± SE. Y-axis represents mRNAs expressed as fragments per kilobase of exon per million reads mapped (FPKM). (B) Liver, kidney, and small intestine from C57BL/6 mice of 60 d old. n = 2, mean ± SE. Y-axis represents relative mRNA expression with values of liver set as 1.0.
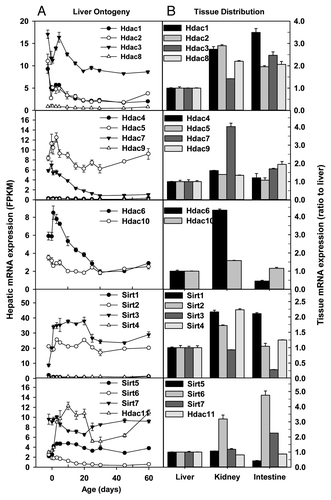
Figure 2. Hepatic ontogeny (A) and tissue distribution (B) of mRNAs of genes involved in histone acetylation in male C57BL/6 mice. (A) Liver from C57BL/6 mice of ages from Day 2 to Day 60. n = 3, mean ± SE. Y-axis represents mRNAs expressed as fragments per kilobase of exon per million reads mapped (FPKM). (B) Liver, kidney, and small intestine from C57BL/6 mice of 60 d old. n = 2, mean ± SE. Y-axis represents relative mRNA expression with values of liver set as 1.0.
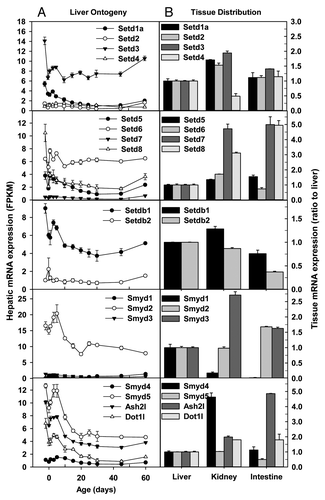
Figure 3. Hepatic ontogeny (A) and tissue distribution (B) of mRNAs of genes involved in histone deacetylation in male C57BL/6 mice. (A) Liver from C57BL/6 mice of ages from Day 2 to Day 60. n = 3, mean ± SE. Y-axis represents mRNAs expressed as fragments per kilobase of exon per million reads mapped (FPKM). (B) Liver, kidney, and small intestine from C57BL/6 mice of 60 d old. n = 2, mean ± SE. Y-axis represents relative mRNA expression with values of liver set as 1.0.
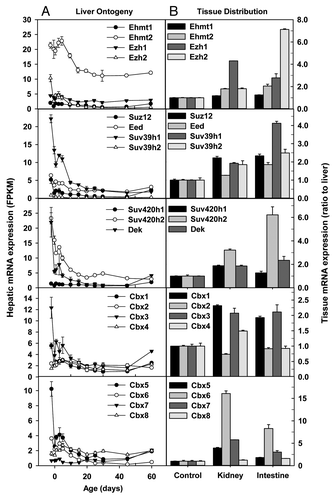
Figure 3. Hepatic ontogeny (A) and tissue distribution (B) of mRNAs of genes involved in histone deacetylation in male C57BL/6 mice. (A) Liver from C57BL/6 mice of ages from Day 2 to Day 60. n = 3, mean ± SE. Y-axis represents mRNAs expressed as fragments per kilobase of exon per million reads mapped (FPKM). (B) Liver, kidney, and small intestine from C57BL/6 mice of 60 d old. n = 2, mean ± SE. Y-axis represents relative mRNA expression with values of liver set as 1.0.
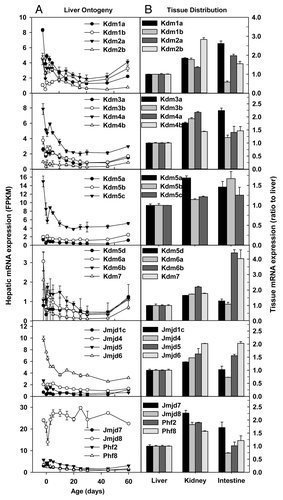
Figure 4. Hepatic ontogeny (A) and tissue distribution (B) of mRNAs of genes involved in histone methylation in male C57BL/6 mice. (A) Liver from C57BL/6 mice of ages from Day 2 to Day 60. n = 3, mean ± SE. Y-axis represents mRNAs expressed as fragments per kilobase of exon per million reads mapped (FPKM). (B) Liver, kidney, and small intestine from C57BL/6 mice of 60 d old. n = 2, mean ± SE. Y-axis represents relative mRNA expression with values of liver set as 1.0.
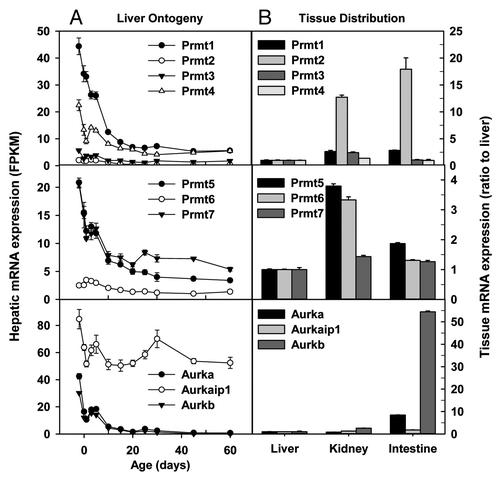
Figure 4. Hepatic ontogeny (A) and tissue distribution (B) of mRNAs of genes involved in histone methylation in male C57BL/6 mice. (A) Liver from C57BL/6 mice of ages from Day 2 to Day 60. n = 3, mean ± SE. Y-axis represents mRNAs expressed as fragments per kilobase of exon per million reads mapped (FPKM). (B) Liver, kidney, and small intestine from C57BL/6 mice of 60 d old. n = 2, mean ± SE. Y-axis represents relative mRNA expression with values of liver set as 1.0.
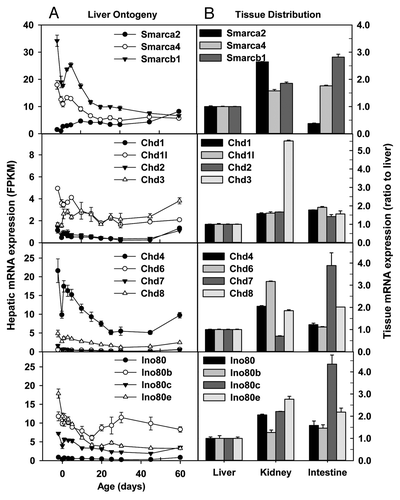
Figure 5. Hepatic ontogeny (A) and tissue distribution (B) of mRNAs of genes involved in histone methylation and recognition of methylated histones in male C57BL/6 mice. (A) Liver from C57BL/6 mice of ages from Day 2 to Day 60. n = 3, mean ± SE. Y-axis represents mRNAs expressed as fragments per kilobase of exon per million reads mapped (FPKM). (B) Liver, kidney, and small intestine from C57BL/6 mice of 60 d old. n = 2, mean ± SE. Y-axis represents relative mRNA expression with values of liver set as 1.0.

Figure 5. Hepatic ontogeny (A) and tissue distribution (B) of mRNAs of genes involved in histone methylation and recognition of methylated histones in male C57BL/6 mice. (A) Liver from C57BL/6 mice of ages from Day 2 to Day 60. n = 3, mean ± SE. Y-axis represents mRNAs expressed as fragments per kilobase of exon per million reads mapped (FPKM). (B) Liver, kidney, and small intestine from C57BL/6 mice of 60 d old. n = 2, mean ± SE. Y-axis represents relative mRNA expression with values of liver set as 1.0.

Figure 6. Hepatic ontogeny (A) and tissue distribution (B) of mRNAs of genes involved in histone demethylation in male C57BL/6 mice. (A) Liver from C57BL/6 mice of ages from Day 2 to Day 60. n = 3, mean ± SE. Y-axis represents mRNAs expressed as fragments per kilobase of exon per million reads mapped (FPKM). (B) Liver, kidney, and small intestine from C57BL/6 mice of 60 d old. n = 2, mean ± SE. Y-axis represents relative mRNA expression with values of liver set as 1.0.

Figure 6. Hepatic ontogeny (A) and tissue distribution (B) of mRNAs of genes involved in histone demethylation in male C57BL/6 mice. (A) Liver from C57BL/6 mice of ages from Day 2 to Day 60. n = 3, mean ± SE. Y-axis represents mRNAs expressed as fragments per kilobase of exon per million reads mapped (FPKM). (B) Liver, kidney, and small intestine from C57BL/6 mice of 60 d old. n = 2, mean ± SE. Y-axis represents relative mRNA expression with values of liver set as 1.0.

Figure 7. Hepatic ontogeny (A) and tissue distribution (B) of mRNAs of genes involved in methylation of histone arginine residues and phosphorylation of histones in male C57BL/6 mice. (A) Liver from C57BL/6 mice of ages from Day 2 to Day 60. n = 3, mean ± SE. Y-axis represents mRNAs expressed as fragments per kilobase of exon per million reads mapped (FPKM). (B) Liver, kidney, and small intestine from C57BL/6 mice of 60 d old. n = 2, mean ± SE. Y-axis represents relative mRNA expression with values of liver set as 1.0.

Figure 7. Hepatic ontogeny (A) and tissue distribution (B) of mRNAs of genes involved in methylation of histone arginine residues and phosphorylation of histones in male C57BL/6 mice. (A) Liver from C57BL/6 mice of ages from Day 2 to Day 60. n = 3, mean ± SE. Y-axis represents mRNAs expressed as fragments per kilobase of exon per million reads mapped (FPKM). (B) Liver, kidney, and small intestine from C57BL/6 mice of 60 d old. n = 2, mean ± SE. Y-axis represents relative mRNA expression with values of liver set as 1.0.

Figure 8. Hepatic ontogeny (A) and tissue distribution (B) of mRNAs of genes involved in chromosome remodeling in male C57BL/6 mice. (A) Liver from C57BL/6 mice of ages from Day 2 to Day 60. n = 3, mean ± SE. Y-axis represents mRNAs expressed as fragments per kilobase of exon per million reads mapped (FPKM). (B) Liver, kidney, and small intestine from C57BL/6 mice of 60 d old. n = 2, mean ± SE. Y-axis represents relative mRNA expression with values of liver set as 1.0.

Figure 8. Hepatic ontogeny (A) and tissue distribution (B) of mRNAs of genes involved in chromosome remodeling in male C57BL/6 mice. (A) Liver from C57BL/6 mice of ages from Day 2 to Day 60. n = 3, mean ± SE. Y-axis represents mRNAs expressed as fragments per kilobase of exon per million reads mapped (FPKM). (B) Liver, kidney, and small intestine from C57BL/6 mice of 60 d old. n = 2, mean ± SE. Y-axis represents relative mRNA expression with values of liver set as 1.0.

Figure 9. Real-Time PCR validation of RNA-seq data of ontogenic mRNA expression of epigenetic factors in livers of male C57BL/6 mice. Total RNAs from livers of male C57BL/6 mice of ages of Day 2, 1, 5, 10, 20, 25, 45, and 60 were used for Real-time PCR validation. n = 3, mean ± SE. Y-axis represents mRNAs calculated by the comparative CT method, which determines the amount of target normalized to the geometric mean of Gapdh and Ncu-g1. * p < 0.05 vs. Day 2.
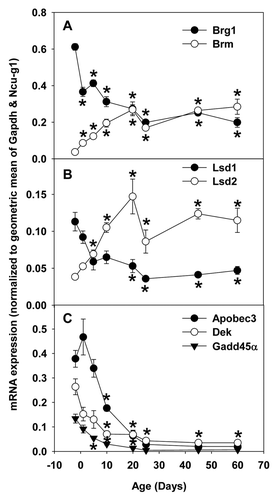
Figure 9. Real-Time PCR validation of RNA-seq data of ontogenic mRNA expression of epigenetic factors in livers of male C57BL/6 mice. Total RNAs from livers of male C57BL/6 mice of ages of Day 2, 1, 5, 10, 20, 25, 45, and 60 were used for Real-time PCR validation. n = 3, mean ± SE. Y-axis represents mRNAs calculated by the comparative CT method, which determines the amount of target normalized to the geometric mean of Gapdh and Ncu-g1. * p < 0.05 vs. Day 2.
Supplemental material

Additional material

Download Zip (122.4 KB)

Reprints and Corporate Permissions

Please note: Selecting permissions does not provide access to the full text of the article, please see our help page How do I view content?

To request a reprint or corporate permissions for this article, please click on the relevant link below:

Academic Permissions

Please note: Selecting permissions does not provide access to the full text of the article, please see our help page How do I view content?

Obtain permissions instantly via Rightslink by clicking on the button below:

If you are unable to obtain permissions via Rightslink, please complete and submit this Permissions form. For more information, please visit our Permissions help page.