1,281
Views
69
CrossRef citations to date
0
Altmetric
Research Paper

HDAC isoenzyme expression is deregulated in chronic lymphocytic leukemia B-cells and has a complex prognostic significance

, , , , , & show all
Pages 1403-1412 | Published online: 29 Oct 2012

Figures & data

Figure 1. HDAC expression in CLL, PB and UCB samples. The mean expression of the different HDACs in CLL (n = 200), PB (n = 20) and UCB (n = 20) was plotted with the standard error of the mean (SEM) according to HDAC class I (A), class II (B), class III (C) and class IV (D). HDAC values are expressed as relative fold change normalized to cyclophilin gene expression and calibrated with a common value. Significant differences were assessed using the Mann-Whitney non-parametric test. Statistical details can be found in Table S1.
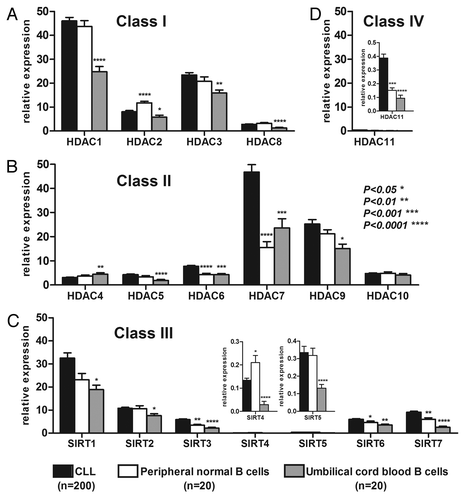
Figure 1. HDAC expression in CLL, PB and UCB samples. The mean expression of the different HDACs in CLL (n = 200), PB (n = 20) and UCB (n = 20) was plotted with the standard error of the mean (SEM) according to HDAC class I (A), class II (B), class III (C) and class IV (D). HDAC values are expressed as relative fold change normalized to cyclophilin gene expression and calibrated with a common value. Significant differences were assessed using the Mann-Whitney non-parametric test. Statistical details can be found in Table S1.

Figure 2. Significant TFS or OS power of HDAC expression. Representative TFS curves for HDAC6 (A) and OS curves for HDAC3 (B), SIRT2 (C), SIRT3 (D) and SIRT6 (E). HDACs were measured by real-time PCR, and cut-offs were optimized to maximize ZAP70 concordance and minimize false negatives using ROC curve analyses. Significant differences between curves were calculated using the log-rank test. Statistical details can be found Table S3.
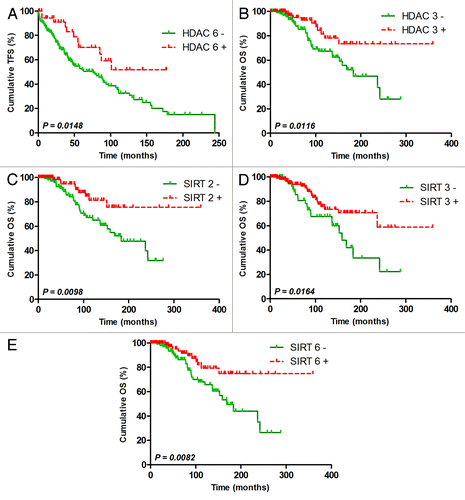
Figure 2. Significant TFS or OS power of HDAC expression. Representative TFS curves for HDAC6 (A) and OS curves for HDAC3 (B), SIRT2 (C), SIRT3 (D) and SIRT6 (E). HDACs were measured by real-time PCR, and cut-offs were optimized to maximize ZAP70 concordance and minimize false negatives using ROC curve analyses. Significant differences between curves were calculated using the log-rank test. Statistical details can be found Table S3.

Table 1. Univariate and multivariate cox analysis for TFS and OS

Figure 3. TFS and OS score based on selected HDAC expression. TFS scores composed of HDAC6, 7 and 10 and SIRT3 selected by a multivariate stepwise Cox analysis were used to plot TFS with Kaplan-Meier curves for all Binet stages (A) and only Binet stage A (B). OS scores composed of SIRT5 and 6 selected by a multivariate stepwise Cox analysis were used to plot OS with Kaplan-Meier curves for all Binet stages (C) and only Binet stage A (D). The hazard ratio (HR) was calculated with univariate Cox regression.
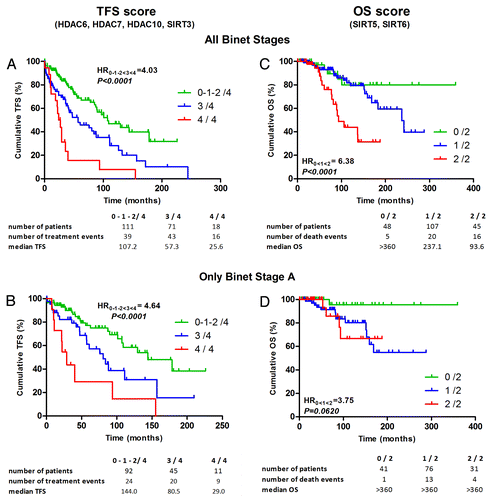
Figure 3. TFS and OS score based on selected HDAC expression. TFS scores composed of HDAC6, 7 and 10 and SIRT3 selected by a multivariate stepwise Cox analysis were used to plot TFS with Kaplan-Meier curves for all Binet stages (A) and only Binet stage A (B). OS scores composed of SIRT5 and 6 selected by a multivariate stepwise Cox analysis were used to plot OS with Kaplan-Meier curves for all Binet stages (C) and only Binet stage A (D). The hazard ratio (HR) was calculated with univariate Cox regression.

Figure 4. HDAC profile comparison between samples obtained at diagnosis and after relapse. Different HDAC isoenzyme expressions were plotted for 8 CLL patients for samples obtained at diagnosis and after relapse. HDAC values are expressed as relative fold change normalized to cyclophilin gene expression and calibrated with a common value. Significant differences were assessed using the Wilcoxon signed rank test.
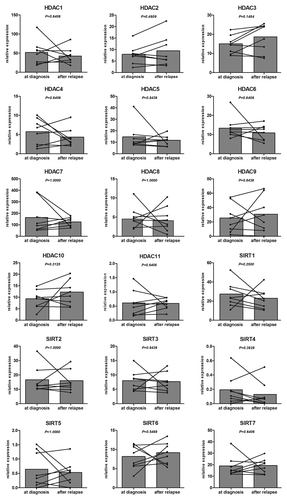
Figure 4. HDAC profile comparison between samples obtained at diagnosis and after relapse. Different HDAC isoenzyme expressions were plotted for 8 CLL patients for samples obtained at diagnosis and after relapse. HDAC values are expressed as relative fold change normalized to cyclophilin gene expression and calibrated with a common value. Significant differences were assessed using the Wilcoxon signed rank test.
Supplemental material

Additional material

Download Zip (652.6 KB)