751
Views
11
CrossRef citations to date
0
Altmetric
Research Paper

Tissue-specific relationship of S-adenosylhomocysteine with allele-specific H19/Igf2 methylation and imprinting in mice with hyperhomocysteinemia

, , , , &
Pages 44-53 | Received 21 Sep 2012, Accepted 29 Nov 2012, Published online: 05 Dec 2012

Figures & data

Table 1. Changes in body weight, plasma total homocysteine and methionine, and liver and brain methylation capacity in F1 mice

Figure 1. Schematic representation of the H19/ Igf2 loci in mice illustrating the region analyzed for methylation status. (A) The CpG-rich H19 DMD sequences analyzed for methylation status is shown. The CpG sites are bolded. Numbering of the sequence is relative to the transcriptional start site (+1). *A species-specific variant, a G (C57BL/6J allele) → A (Cast allele) at nucleotide -4437, was used to distinguish the Cast allele from the C57BL/6J (Cbs+/+ and Cbs+/−) allele. (B) Levels of methylation in samples containing known amounts of the C57BL/6J (Cbs+/+ or Cbs+/−) maternal allele and paternal allele. Results shown are the mean ± SD.
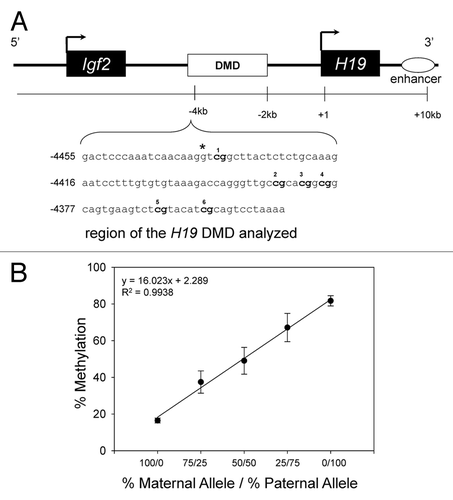
Figure 1. Schematic representation of the H19/ Igf2 loci in mice illustrating the region analyzed for methylation status. (A) The CpG-rich H19 DMD sequences analyzed for methylation status is shown. The CpG sites are bolded. Numbering of the sequence is relative to the transcriptional start site (+1). *A species-specific variant, a G (C57BL/6J allele) → A (Cast allele) at nucleotide -4437, was used to distinguish the Cast allele from the C57BL/6J (Cbs+/+ and Cbs+/−) allele. (B) Levels of methylation in samples containing known amounts of the C57BL/6J (Cbs+/+ or Cbs+/−) maternal allele and paternal allele. Results shown are the mean ± SD.

Table 2. Allele-specific H19 DMD methylation status in liver from F1 mice with HHcy

Figure 2. Allele-specific methylation status of the H19 DMD in mice with HHcy. Maternal (Cbs+/+ and Cbs+/−) allele and paternal (Cast) allele H19 DMD mean (6 CpGs) methylation status in (A) liver and (B) brain. Values shown are mean ± SE (n = 5–6 mice per group). * p < 0.05, vs. F1 Cast x Cbs +/+ mice fed the control diet. ** p < 0.05, vs. F1 Cast × Cbs+/+ mice fed the HH diet.
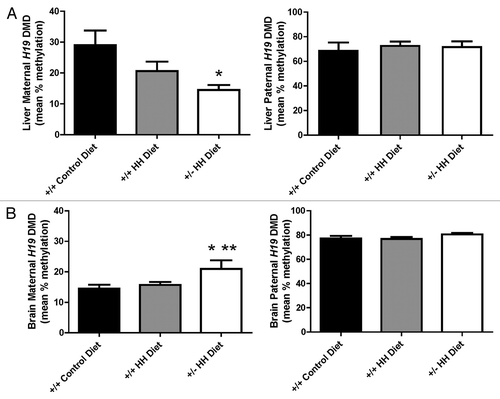
Figure 2. Allele-specific methylation status of the H19 DMD in mice with HHcy. Maternal (Cbs+/+ and Cbs+/−) allele and paternal (Cast) allele H19 DMD mean (6 CpGs) methylation status in (A) liver and (B) brain. Values shown are mean ± SE (n = 5–6 mice per group). * p < 0.05, vs. F1 Cast x Cbs +/+ mice fed the control diet. ** p < 0.05, vs. F1 Cast × Cbs+/+ mice fed the HH diet.

Table 3. Allele-specific H19 DMD methylation status in brain from F1 mice with HHcy

Figure 3. Relationship between the maternal H19 DMD allele methylation status and tissue concentrations of AdoMet and AdoHcy in mice. (A) Relationship between liver AdoMet and AdoHcy concentrations and the methylation status of the maternal H19 DMD allele in liver. (B) Relationship between brain AdoMet and AdoHcy concentrations and the methylation status of the maternal H19 DMD allele in brain. ▲, F1 Cast × Cbs+/+ mice fed the control diet; ●, F1 Cast × Cbs+/+ mice fed the HH diet; □, Cast × Cbs+/− mice fed the HH diet.
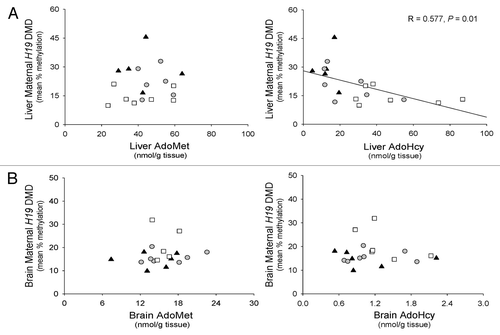
Figure 3. Relationship between the maternal H19 DMD allele methylation status and tissue concentrations of AdoMet and AdoHcy in mice. (A) Relationship between liver AdoMet and AdoHcy concentrations and the methylation status of the maternal H19 DMD allele in liver. (B) Relationship between brain AdoMet and AdoHcy concentrations and the methylation status of the maternal H19 DMD allele in brain. ▲, F1 Cast × Cbs+/+ mice fed the control diet; ●, F1 Cast × Cbs+/+ mice fed the HH diet; □, Cast × Cbs+/− mice fed the HH diet.

Figure 4. Expression of H19 and Igf2 genes in F1 mice with HHcy. Levels of H19 and Igf2 mRNA in (A) liver and (B) brain. Values shown are mean ± SE (n = 7–9 mice/group). *p < 0.05, vs. F1 Cast × Cbs+/+ mice fed the control diet. **p < 0.05, vs. F1 Cast × Cbs+/+ mice fed the HH diet.
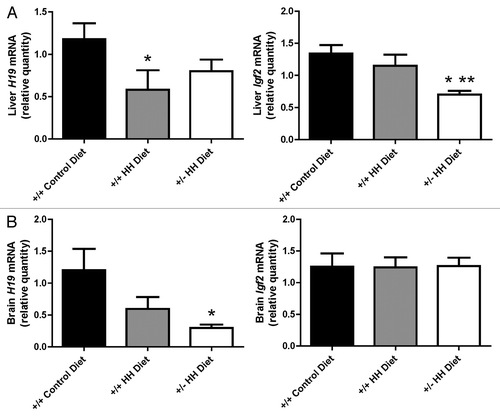
Figure 4. Expression of H19 and Igf2 genes in F1 mice with HHcy. Levels of H19 and Igf2 mRNA in (A) liver and (B) brain. Values shown are mean ± SE (n = 7–9 mice/group). *p < 0.05, vs. F1 Cast × Cbs+/+ mice fed the control diet. **p < 0.05, vs. F1 Cast × Cbs+/+ mice fed the HH diet.

Figure 5. Allele-specific expression of Igf2. (A) Representative gel image illustrating maternal, paternal, and biallelic Igf2 expression. PCR products were resolved on 6% agarose gels and the maternal (C57BL/6J) allele distinguished by the presence of a band at 119 bp and the paternal (Cast) allele distinguished by the presence of a band at 127 bp. M, maternal; P, paternal; B, biallelic. Allele-specific expression in (B) liver and (C) brain from F1 mice with HHcy. Values shown are the percentage of mice (n = 6 mice/group) in each group expressing the maternal, paternal or both (biallelic) alleles.
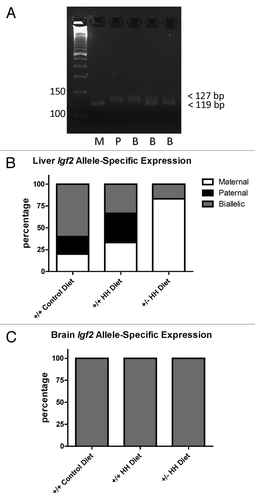
Figure 5. Allele-specific expression of Igf2. (A) Representative gel image illustrating maternal, paternal, and biallelic Igf2 expression. PCR products were resolved on 6% agarose gels and the maternal (C57BL/6J) allele distinguished by the presence of a band at 119 bp and the paternal (Cast) allele distinguished by the presence of a band at 127 bp. M, maternal; P, paternal; B, biallelic. Allele-specific expression in (B) liver and (C) brain from F1 mice with HHcy. Values shown are the percentage of mice (n = 6 mice/group) in each group expressing the maternal, paternal or both (biallelic) alleles.

Reprints and Corporate Permissions

Please note: Selecting permissions does not provide access to the full text of the article, please see our help page How do I view content?

To request a reprint or corporate permissions for this article, please click on the relevant link below:

Academic Permissions

Please note: Selecting permissions does not provide access to the full text of the article, please see our help page How do I view content?

Obtain permissions instantly via Rightslink by clicking on the button below:

If you are unable to obtain permissions via Rightslink, please complete and submit this Permissions form. For more information, please visit our Permissions help page.