1,108
Views
36
CrossRef citations to date
0
Altmetric
Research Paper

The epigenome of AML stem and progenitor cells

, , , , , , , , , , & show all
Pages 92-104 | Published online: 18 Dec 2012

Figures & data

Figure 1. DNA methylation level of stem, progenitor, and mature cells for (A) stem cell-related genes and (B) differentially methylated genes in AML by bisulfite-pyrosequencing. Each symbol represents a different patient and lines link results of different cell fractions in the same patients. Normal corresponds to unfractionated peripheral blood cell DNA in four separate control individuals.
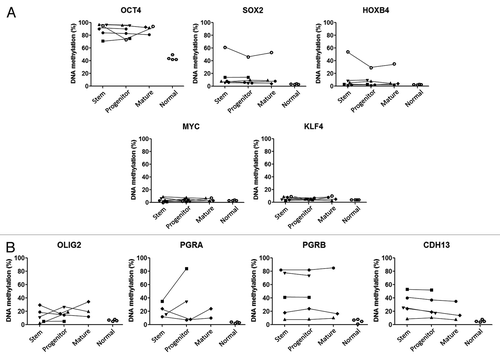
Figure 1. DNA methylation level of stem, progenitor, and mature cells for (A) stem cell-related genes and (B) differentially methylated genes in AML by bisulfite-pyrosequencing. Each symbol represents a different patient and lines link results of different cell fractions in the same patients. Normal corresponds to unfractionated peripheral blood cell DNA in four separate control individuals.
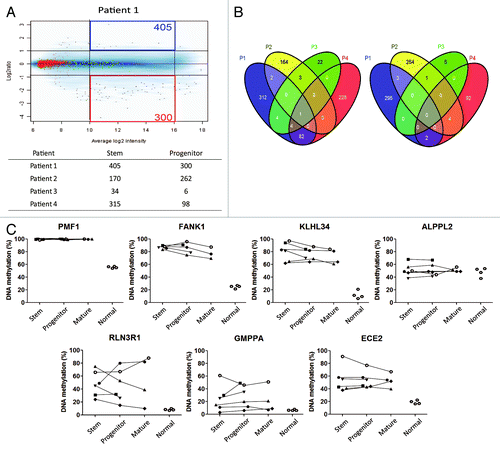
Figure 2. (A) Methylated CpG island amplificationmicroarray analyses (MCAM) of AML cell fractions. A representative MCAM for stem vs progenitor cells from an AML patient (Patient 1). Differentially methylated probes are defined as having average log2 intensity with intermediate signal and > 2 fold higher in stem (blue) or progenitor (red). The numbers of each differentially methylated probe are shown in the corners. Below the graph is a summary of the number of differentially methylated probes (B) Venn diagram for the probes methylated across patients in stem (left) and progenitor (right) cells. (C) DNA methylation level by bisulfite-pyrosequencing for the genes which showed more methylation in AML stem (upper) and in progenitor (lower) cells in MCAM analysis. Each symbol represents a different patient and lines link results of different cell fractions in the same patients. Normal corresponds to unfractionated peripheral blood cell DNA in four separate control individuals.

Figure 2. (A) Methylated CpG island amplificationmicroarray analyses (MCAM) of AML cell fractions. A representative MCAM for stem vs progenitor cells from an AML patient (Patient 1). Differentially methylated probes are defined as having average log2 intensity with intermediate signal and > 2 fold higher in stem (blue) or progenitor (red). The numbers of each differentially methylated probe are shown in the corners. Below the graph is a summary of the number of differentially methylated probes (B) Venn diagram for the probes methylated across patients in stem (left) and progenitor (right) cells. (C) DNA methylation level by bisulfite-pyrosequencing for the genes which showed more methylation in AML stem (upper) and in progenitor (lower) cells in MCAM analysis. Each symbol represents a different patient and lines link results of different cell fractions in the same patients. Normal corresponds to unfractionated peripheral blood cell DNA in four separate control individuals.

Figure 3. (A) Histone mark enrichment by gene expression patterns in P10. Gene expression patterns were divided into high (top 2,000 genes), intermediate (medium 2000 genes), and low (bottom 2000 genes). (B) Categories of promoter histone marks (K4 only, K27 only, bivalent and none) and associated gene expression levels. (C) Numbers of the genes with respective histone status. Gene expression data was taken from GEO data set GSE24006.
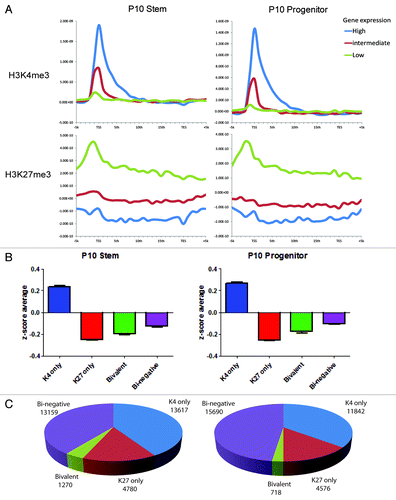
Figure 3. (A) Histone mark enrichment by gene expression patterns in P10. Gene expression patterns were divided into high (top 2,000 genes), intermediate (medium 2000 genes), and low (bottom 2000 genes). (B) Categories of promoter histone marks (K4 only, K27 only, bivalent and none) and associated gene expression levels. (C) Numbers of the genes with respective histone status. Gene expression data was taken from GEO data set GSE24006.

Figure 4. Pathway analysis for genes enriched in K4 (upper) or K27 (lower) in P10. The Venn diagrams show overlap in genes marked by K4 or K27 in their promoters. Ingenuity pathway analysis was performed with the exclusively enriched genes in stem or progenitor cells. Bars show p values in –log (p value) for each pathway. Rectangles on each bar show ratio calculated by the number of molecules in a given pathway divided by total number of molecules that make up that pathway. Pathways are listed in order of a rank from the most associated pathway.
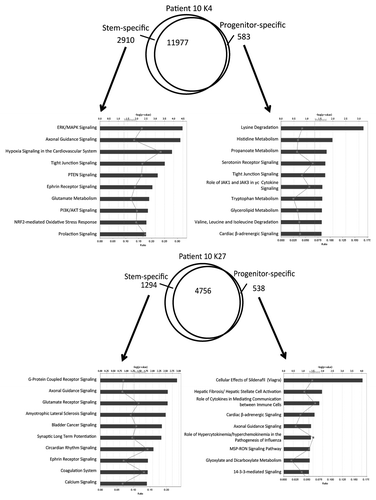
Figure 4. Pathway analysis for genes enriched in K4 (upper) or K27 (lower) in P10. The Venn diagrams show overlap in genes marked by K4 or K27 in their promoters. Ingenuity pathway analysis was performed with the exclusively enriched genes in stem or progenitor cells. Bars show p values in –log (p value) for each pathway. Rectangles on each bar show ratio calculated by the number of molecules in a given pathway divided by total number of molecules that make up that pathway. Pathways are listed in order of a rank from the most associated pathway.

Figure 5. Histone switches in AML stem vs. progenitor cells. (A) Number of genes in each histone category in stem and progenitor AML cells. Arrows point to the histone status in progenitor cells by baseline histone status in stem cells. Thus, of 13617 K4 only promoters in stem cells, 83% remain K4 only in progenitor cells and 17% switch to other histone status. (B) Graphical representation of data shown in (A). (C) Pathway analysis for the genes that are bivalent in stem cells and switch to K4 only or K27 only in progenitor cells.
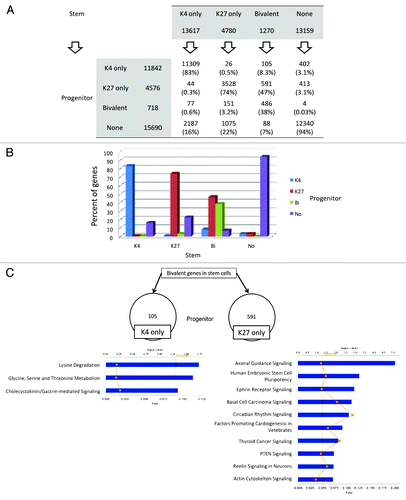
Figure 5. Histone switches in AML stem vs. progenitor cells. (A) Number of genes in each histone category in stem and progenitor AML cells. Arrows point to the histone status in progenitor cells by baseline histone status in stem cells. Thus, of 13617 K4 only promoters in stem cells, 83% remain K4 only in progenitor cells and 17% switch to other histone status. (B) Graphical representation of data shown in (A). (C) Pathway analysis for the genes that are bivalent in stem cells and switch to K4 only or K27 only in progenitor cells.

Figure 6. Relation between switches in histone status and differential expression in AML. (A) K4 switches for genes that show high expression in stem cells (stem-high) or in progenitor cells (progenitor-high). In each patient (P10, P7–9, and P11), most genes show no histone switches (gray), but a significant minority show consistent changes (K4 switches tracking with expression switches). (B) Percent of bivalent promoters among genes that show differential expression in stem or progenitor cells. (C) Bivalent genes in stem cells (red) show preferential loss of expression compared with non-bivalent genes (black).
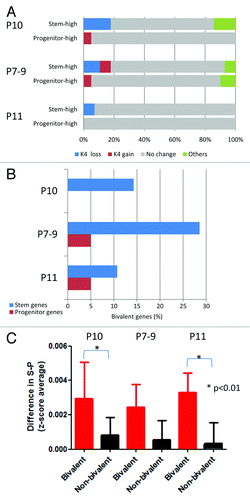
Figure 6. Relation between switches in histone status and differential expression in AML. (A) K4 switches for genes that show high expression in stem cells (stem-high) or in progenitor cells (progenitor-high). In each patient (P10, P7–9, and P11), most genes show no histone switches (gray), but a significant minority show consistent changes (K4 switches tracking with expression switches). (B) Percent of bivalent promoters among genes that show differential expression in stem or progenitor cells. (C) Bivalent genes in stem cells (red) show preferential loss of expression compared with non-bivalent genes (black).

Figure 7. Chromatin changes from stem to progenitor to the most differentiated cells (mature cells). (A) Comparison of numbers of promoter genes with respective histone status. (B) Representative histone modification patterns of K4-enrichment for a stem-cell gene (KRAS) and a differentiation marker (CD14) and K27-enrichment of a stem-cell gene (ADRA2C) and a mature-cell gene (IFNA6). (C) K4/K27 mark change upon differentiation in Patient 10. Percentages of each histone status are shown in in bar graphs for differentiation from stem to mature cells (upper) and from progenitor to mature cells (lower).
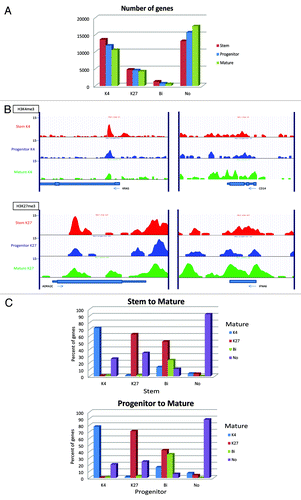
Figure 7. Chromatin changes from stem to progenitor to the most differentiated cells (mature cells). (A) Comparison of numbers of promoter genes with respective histone status. (B) Representative histone modification patterns of K4-enrichment for a stem-cell gene (KRAS) and a differentiation marker (CD14) and K27-enrichment of a stem-cell gene (ADRA2C) and a mature-cell gene (IFNA6). (C) K4/K27 mark change upon differentiation in Patient 10. Percentages of each histone status are shown in in bar graphs for differentiation from stem to mature cells (upper) and from progenitor to mature cells (lower).
Supplemental material

Additional material

Download Zip (1.5 MB)