996
Views
17
CrossRef citations to date
0
Altmetric
Brief Report

Breaking through an epigenetic wall

Re-activation of Oct4 by KRAB-containing designer zinc finger transcription factors

, , , , , , & show all
Pages 164-176 | Received 08 Nov 2012, Accepted 04 Jan 2013, Published online: 11 Jan 2013

Figures & data

Figure 1. Differential endogenous expression of Oct4, Sox2 and Nanog in breast and ovarian cell lines. Endogenous Oct4, Sox2 and Nanog mRNA levels as assessed by quantitative real-time PCR in a panel of different breast (A) and ovarian (B) cell lines. Real-time quantification of each gene expression was normalized to the fibroblast cell samples. hESCs, p86-OTBC-L1 and NT2/D1 cells represented positive controls for Oct4, Sox2 and Nanog expression. Primary ovarian cancer cell cultures were generated from cells isolated from the ascites of patients with epithelial ovarian cancer. Experiments were run in triplicate and data represent the mean ± SD of three independent experiments as determined by the Student’s t-test (*p ≤ 0.01). (C) Immunofluorescence (IF) Oct4 protein expression and intracellular localization of Oct4 in different human cell lines: Fibroblasts, Human Mammary Epithelial cells (HMEC) and cancer cells: MDA-MB-231 (Breast), OVCAR-3 and PA-1 (Ovarian) and p86-OTBC-L1 (breast) cell lines. (D) Methylation status of Oct4 promoter in Fibroblasts, HMEC, MDA-MB-231 OVCAR-3, PA-1 and p86-OCTB-L1 cell lines. The X-axis represent the nucleotide position relative to translation start site, and the Y-axis the percentage of methylation along the Oct4 proximal promoter, assessed with a Sequenom EpiTYPER platform. Pink arrows indicate specific CpG di-nucleotides where methylation frequencies decreased significantly in the tumor samples relative to the non-transformed fibroblast or HUMEC cells.
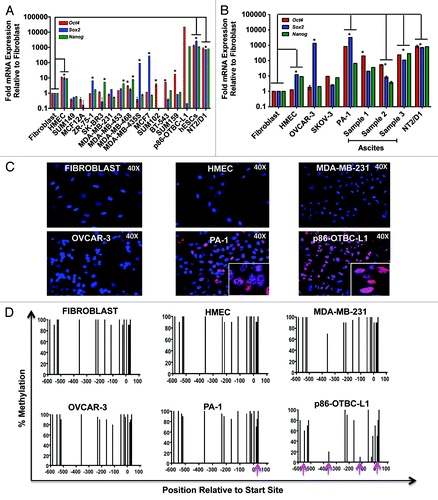
Figure 1. Differential endogenous expression of Oct4, Sox2 and Nanog in breast and ovarian cell lines. Endogenous Oct4, Sox2 and Nanog mRNA levels as assessed by quantitative real-time PCR in a panel of different breast (A) and ovarian (B) cell lines. Real-time quantification of each gene expression was normalized to the fibroblast cell samples. hESCs, p86-OTBC-L1 and NT2/D1 cells represented positive controls for Oct4, Sox2 and Nanog expression. Primary ovarian cancer cell cultures were generated from cells isolated from the ascites of patients with epithelial ovarian cancer. Experiments were run in triplicate and data represent the mean ± SD of three independent experiments as determined by the Student’s t-test (*p ≤ 0.01). (C) Immunofluorescence (IF) Oct4 protein expression and intracellular localization of Oct4 in different human cell lines: Fibroblasts, Human Mammary Epithelial cells (HMEC) and cancer cells: MDA-MB-231 (Breast), OVCAR-3 and PA-1 (Ovarian) and p86-OTBC-L1 (breast) cell lines. (D) Methylation status of Oct4 promoter in Fibroblasts, HMEC, MDA-MB-231 OVCAR-3, PA-1 and p86-OCTB-L1 cell lines. The X-axis represent the nucleotide position relative to translation start site, and the Y-axis the percentage of methylation along the Oct4 proximal promoter, assessed with a Sequenom EpiTYPER platform. Pink arrows indicate specific CpG di-nucleotides where methylation frequencies decreased significantly in the tumor samples relative to the non-transformed fibroblast or HUMEC cells.

Figure 2. Design of an ATF/Artificial ZFP to upregulate the endogenous Oct4 promoter. (A) Schematic illustration of the Oct4 human promoter outlining the 18-bp ZF-119 targeted sequence and its location at position -119, relative to the translation start site (first-Met coding ATG triplet, +1). The ZF-119 sequence was chosen because of the high degree of conservation across vertebrate species, and because of its close proximity to the translation start site, which is typically accessible by TFs and nucleosome-free. Numbers designate the distance in bps relative to the start of translation. A putative binding site for SP1 is indicated in green; a putative Hormone Response Element (HRE) site is outlined with an open box; the Sox2 binding-site and its recognition sequence at position -236 are shown in blue; the Conservative Regions CR1 to CR4 within the promoter are shown in gray. Conservative Region 4 (CR4) contains the binding site for Oct4 and Sox2 proteins (red and blue circles and red and blue sequences, respectively). Arrows show the orientation of the 18-bp binding site in the promoter (from 5′ to 3′). (B) Schematic representation of the ZFPs generated in this study. The 6-Zinc Finger (ZF) arrays bound to DNA in absence of effector domains are indicated as ZF-119. Indicated below is an schematic representation of the different constructs, outlining the orientation of the effector domains linked to the ZF-119: KRAB, VP16, VP64 (4x VP16 domain) and Dnmt3a (C) Alphα-helical ZF amino acid sequences of ZF-119 engineered to bind their corresponding target DNA triplets (5′ to 3′). The helical residues at positions -1, +3 and +6 make specific contacts with the recognition triplets (blue refers to position -1, red for position +3 and purple for position +6).
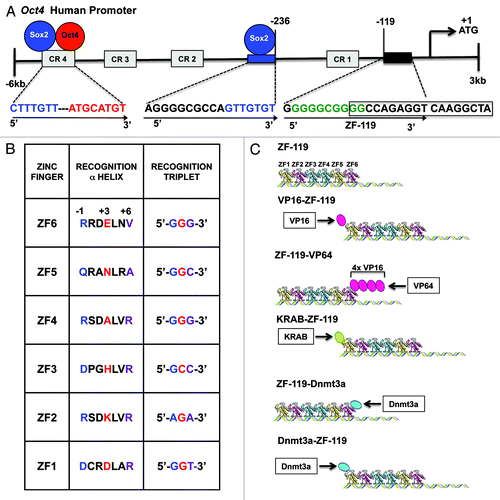
Figure 2. Design of an ATF/Artificial ZFP to upregulate the endogenous Oct4 promoter. (A) Schematic illustration of the Oct4 human promoter outlining the 18-bp ZF-119 targeted sequence and its location at position -119, relative to the translation start site (first-Met coding ATG triplet, +1). The ZF-119 sequence was chosen because of the high degree of conservation across vertebrate species, and because of its close proximity to the translation start site, which is typically accessible by TFs and nucleosome-free. Numbers designate the distance in bps relative to the start of translation. A putative binding site for SP1 is indicated in green; a putative Hormone Response Element (HRE) site is outlined with an open box; the Sox2 binding-site and its recognition sequence at position -236 are shown in blue; the Conservative Regions CR1 to CR4 within the promoter are shown in gray. Conservative Region 4 (CR4) contains the binding site for Oct4 and Sox2 proteins (red and blue circles and red and blue sequences, respectively). Arrows show the orientation of the 18-bp binding site in the promoter (from 5′ to 3′). (B) Schematic representation of the ZFPs generated in this study. The 6-Zinc Finger (ZF) arrays bound to DNA in absence of effector domains are indicated as ZF-119. Indicated below is an schematic representation of the different constructs, outlining the orientation of the effector domains linked to the ZF-119: KRAB, VP16, VP64 (4x VP16 domain) and Dnmt3a (C) Alphα-helical ZF amino acid sequences of ZF-119 engineered to bind their corresponding target DNA triplets (5′ to 3′). The helical residues at positions -1, +3 and +6 make specific contacts with the recognition triplets (blue refers to position -1, red for position +3 and purple for position +6).

Figure 3. KRAB-ZF-119 upregulates Oct4 expression in breast and ovarian cancer cell lines. (A-D) Quantification of Oct4, Sox2 and Nanog mRNA expression levels by qRT-PCR in MDA-MB-231 (A-B), SUM159 (C) and OVCAR-3 cells (D). X-axis represents the endogenous expression of these pluripotency TFs in the un-transfected cell line, together with cells transfected with the different ZFP designs. The Oct4 cDNA was transfected in the same pMX vector as positive control for the transfection; Y-axis represents the fold mRNA expression relative to hESCs. The ZFPs were retrovirally delivered in the cells and total mRNA was extracted for quantitative real-time PCR of gene expression and the results were normalized to hESC samples. Experiments were run in triplicate and data represent the mean ± SD of three independent experiments. Statistical significance between samples (e.g KRAB-ZF-119 vs. control) was analyzed by the Student’s t-test (***p < 0.0001; **p ≤ 0.01; *p ≤ 0.05). (E) Detection of Oct4 protein levels (upper panel) by western blot in OVCAR-3 cells transduced with either empty vector (control), VP16-ZF-119, Oct4 cDNA (positive control), KRAB-ZF-119, ZF-119 (no effector domain), ZF-119-VP64, or ZF-119-Dnmt3a. Non-transformed HMEC cells were used as negative control for Oct4 expression; NT2/D1 and p86-OTBC-L1 cells were used as positive cancer cell lines control expressing high levels of Oct4. An anti-Histone H3 antibody was used as loading control. The quantification of the bands of representative western blot is shown in (F). The Oct4 expression was normalized to the NT2/D1 sample. (G). Transduction of KRAB-ZF-119 and Oct4 cDNA in OVCAR-3 cells results in induction of tumorsphere formation. Representative images of the transfected cells are shown, outlining the morphological differences in the cells transfected with the KRAB-ZF-119 and Oct4 cDNA, which formed highly proliferative and compact spheroids. Control refers to empty-vector transduced cells. A quantification of the number of spheroids for each sample is shown in (H). Data representing three independent experiments was normalized to control-transduced cells. Statistical significance was analyzed by the Student’s t-test (***p < 0.0001; **p ≤ 0.01; *p ≤ 0.05).
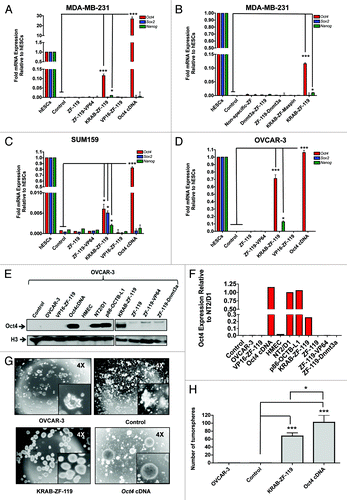
Figure 3. KRAB-ZF-119 upregulates Oct4 expression in breast and ovarian cancer cell lines. (A-D) Quantification of Oct4, Sox2 and Nanog mRNA expression levels by qRT-PCR in MDA-MB-231 (A-B), SUM159 (C) and OVCAR-3 cells (D). X-axis represents the endogenous expression of these pluripotency TFs in the un-transfected cell line, together with cells transfected with the different ZFP designs. The Oct4 cDNA was transfected in the same pMX vector as positive control for the transfection; Y-axis represents the fold mRNA expression relative to hESCs. The ZFPs were retrovirally delivered in the cells and total mRNA was extracted for quantitative real-time PCR of gene expression and the results were normalized to hESC samples. Experiments were run in triplicate and data represent the mean ± SD of three independent experiments. Statistical significance between samples (e.g KRAB-ZF-119 vs. control) was analyzed by the Student’s t-test (***p < 0.0001; **p ≤ 0.01; *p ≤ 0.05). (E) Detection of Oct4 protein levels (upper panel) by western blot in OVCAR-3 cells transduced with either empty vector (control), VP16-ZF-119, Oct4 cDNA (positive control), KRAB-ZF-119, ZF-119 (no effector domain), ZF-119-VP64, or ZF-119-Dnmt3a. Non-transformed HMEC cells were used as negative control for Oct4 expression; NT2/D1 and p86-OTBC-L1 cells were used as positive cancer cell lines control expressing high levels of Oct4. An anti-Histone H3 antibody was used as loading control. The quantification of the bands of representative western blot is shown in (F). The Oct4 expression was normalized to the NT2/D1 sample. (G). Transduction of KRAB-ZF-119 and Oct4 cDNA in OVCAR-3 cells results in induction of tumorsphere formation. Representative images of the transfected cells are shown, outlining the morphological differences in the cells transfected with the KRAB-ZF-119 and Oct4 cDNA, which formed highly proliferative and compact spheroids. Control refers to empty-vector transduced cells. A quantification of the number of spheroids for each sample is shown in (H). Data representing three independent experiments was normalized to control-transduced cells. Statistical significance was analyzed by the Student’s t-test (***p < 0.0001; **p ≤ 0.01; *p ≤ 0.05).

Figure 4. KRAB-ZF-119 binds the endogenous Oct4 promoter and upregulates transcription. (A) Chromatin immunoprecipitation (ChIP) to detect the binding of ZF-119 to its target site in SUM159 cells. An anti-HA antibody was used to capture the ZF-119 bound to its genomic target DNA from control-transduced cancer cells and cells transduced with ZF-119. A quantification of the ChIP assay by densitometric analyses of the bands from the same gel is outlined below. Data was normalized to the input signal. (B) Schematic representation of a proposed transcriptional activation model in the Oct4 gene promoter mediated by KRAB domain. After KRAB-ZF-119 binds to the Oct4 gene promoter, the KRAB domain could recruit and/or facilitate the recruitment of a constellation of transcriptional activating factors including Sox2, facilitating their access and binding to the Oct4 promoter; alternatively the KRAB or KRAB-associated factors could inhibit a transcriptional repressor complex in the proximal promoter resulting in transcriptional activation of the gene promoter.
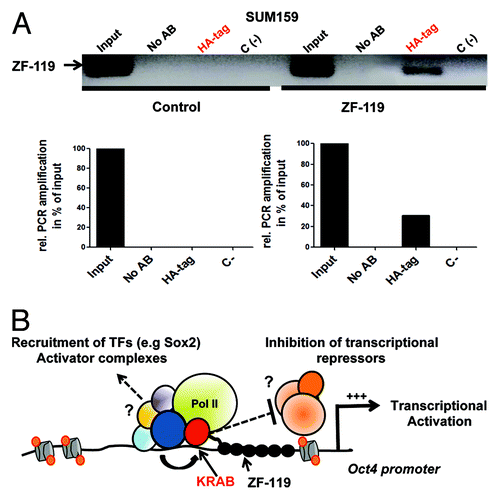
Figure 4. KRAB-ZF-119 binds the endogenous Oct4 promoter and upregulates transcription. (A) Chromatin immunoprecipitation (ChIP) to detect the binding of ZF-119 to its target site in SUM159 cells. An anti-HA antibody was used to capture the ZF-119 bound to its genomic target DNA from control-transduced cancer cells and cells transduced with ZF-119. A quantification of the ChIP assay by densitometric analyses of the bands from the same gel is outlined below. Data was normalized to the input signal. (B) Schematic representation of a proposed transcriptional activation model in the Oct4 gene promoter mediated by KRAB domain. After KRAB-ZF-119 binds to the Oct4 gene promoter, the KRAB domain could recruit and/or facilitate the recruitment of a constellation of transcriptional activating factors including Sox2, facilitating their access and binding to the Oct4 promoter; alternatively the KRAB or KRAB-associated factors could inhibit a transcriptional repressor complex in the proximal promoter resulting in transcriptional activation of the gene promoter.
Supplemental material

Additional material

Download Zip (3.8 MB)

Reprints and Corporate Permissions

Please note: Selecting permissions does not provide access to the full text of the article, please see our help page How do I view content?

To request a reprint or corporate permissions for this article, please click on the relevant link below:

Academic Permissions

Please note: Selecting permissions does not provide access to the full text of the article, please see our help page How do I view content?

Obtain permissions instantly via Rightslink by clicking on the button below:

If you are unable to obtain permissions via Rightslink, please complete and submit this Permissions form. For more information, please visit our Permissions help page.