1,284
Views
54
CrossRef citations to date
0
Altmetric
Research Paper

Methylation-mediated transcriptional repression of microRNAs during cervical carcinogenesis

, , , , , , & show all
Pages 220-228 | Received 24 Oct 2012, Accepted 14 Jan 2013, Published online: 16 Jan 2013

Figures & data

Figure 1. Methylation patterns of selected miRNAs in the cell line panel. Methylation as determined in human foreskin keratinocytes (HFKs), HPV-transformed keratinocyte cell lines FK16A, FK18A and FK18B (reminiscent of high-grade CIN), and cervical cancer cell lines SiHa, HeLa and CaSki is shown for (A) hsa-miR-149, (B) hsa-miR-203, (C) hsa-miR-375, (D) hsa-miR-572 and (E) hsa-miR-638. In (F) ACTB results are shown, indicating successful modification and comparable input for all samples. In vitro methylated DNA (IVD) and unmodified DNA (UD) were included as a positive and negative control, respectively.
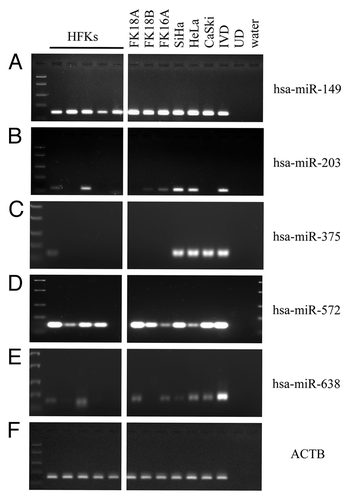
Figure 1. Methylation patterns of selected miRNAs in the cell line panel. Methylation as determined in human foreskin keratinocytes (HFKs), HPV-transformed keratinocyte cell lines FK16A, FK18A and FK18B (reminiscent of high-grade CIN), and cervical cancer cell lines SiHa, HeLa and CaSki is shown for (A) hsa-miR-149, (B) hsa-miR-203, (C) hsa-miR-375, (D) hsa-miR-572 and (E) hsa-miR-638. In (F) ACTB results are shown, indicating successful modification and comparable input for all samples. In vitro methylated DNA (IVD) and unmodified DNA (UD) were included as a positive and negative control, respectively.

Figure 2. Re-expression of methylated miRNAs after demethylating treatment. Expression levels of (A) hsa-miR-149, (B) hsa-miR-203, (C) hsa-miR-375 and (D) hsa-miR-638 were determined in SiHa cells treated with PBS (mock), 200 nM and 5,000 nM DAC. (E) MSP results for hsa-miR-149, -203, -375 and -638 in SiHa cells treated with PBS (mock), 200 nM and 5,000 nM DAC are shown. The ACTB PCR results indicate successful modification and comparable input for all samples.
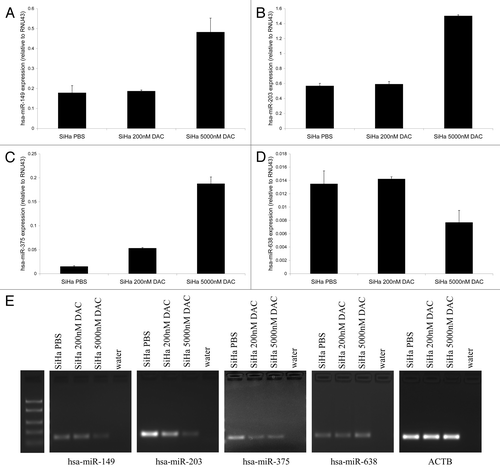
Figure 2. Re-expression of methylated miRNAs after demethylating treatment. Expression levels of (A) hsa-miR-149, (B) hsa-miR-203, (C) hsa-miR-375 and (D) hsa-miR-638 were determined in SiHa cells treated with PBS (mock), 200 nM and 5,000 nM DAC. (E) MSP results for hsa-miR-149, -203, -375 and -638 in SiHa cells treated with PBS (mock), 200 nM and 5,000 nM DAC are shown. The ACTB PCR results indicate successful modification and comparable input for all samples.

Figure 3. Methylation levels in cervical specimens. Methylation levels were determined in tissue specimens of normal cervix (n = 16), CIN1 (n = 4), CIN3 (n = 13) and SCCs (n = 20) for (A) hsa-miR-149, (B) hsa-miR-203 and (C) hsa-miR-375. In (D) methylation levels of hsa-miR-203 are shown in cervical scrapes of hrHPV-positive women with normal cytology and without any CIN disease during 5-y follow-up (n = 13) and in scrapes of hrHPV-positive women with abnormal cytology who presented with high-grade CIN disease within 18 mo (n = 17). hsa-miR-149, -203 and -375 methylation was undetectable in 0, 9 and 11 normals; 0, 2 and 2 CIN1; 1, 1 and 3 CIN3; and 0, 2, and 7 SCCs. Methylation of hsa-miR-203 was undetectable in 6 scrapes with normal cytology and 5 with abnormal cytology. Average methylation levels per sample group are indicated by the horizontal lines. * p < 0.05; ** p < 0.01.
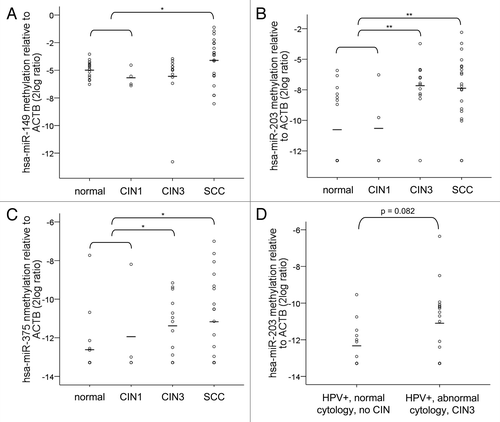
Figure 3. Methylation levels in cervical specimens. Methylation levels were determined in tissue specimens of normal cervix (n = 16), CIN1 (n = 4), CIN3 (n = 13) and SCCs (n = 20) for (A) hsa-miR-149, (B) hsa-miR-203 and (C) hsa-miR-375. In (D) methylation levels of hsa-miR-203 are shown in cervical scrapes of hrHPV-positive women with normal cytology and without any CIN disease during 5-y follow-up (n = 13) and in scrapes of hrHPV-positive women with abnormal cytology who presented with high-grade CIN disease within 18 mo (n = 17). hsa-miR-149, -203 and -375 methylation was undetectable in 0, 9 and 11 normals; 0, 2 and 2 CIN1; 1, 1 and 3 CIN3; and 0, 2, and 7 SCCs. Methylation of hsa-miR-203 was undetectable in 6 scrapes with normal cytology and 5 with abnormal cytology. Average methylation levels per sample group are indicated by the horizontal lines. * p < 0.05; ** p < 0.01.

Figure 4. The effect of ectopic expression of hsa-miR-203 in SiHa cells on cellular proliferation and anchorage independent growth. (A) Expression of hsa-miR-203 in SiHa cells transduced with either the control vector (SiHa + ctrl) or hsa-miR-203 (SiHa + miR-203). In (B) cell viability is shown in SiHa + ctrl cells and SiHa + miR-203 cells. In (C) representative pictures of colony formation in soft agar of SiHa + ctrl cells and SiHa + miR-203 cells and in (D) quantification of the number of colonies in soft agar formed by SiHa + ctrl cells and SiHa + miR-203 cells.
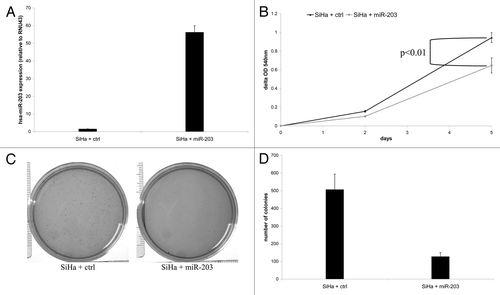
Figure 4. The effect of ectopic expression of hsa-miR-203 in SiHa cells on cellular proliferation and anchorage independent growth. (A) Expression of hsa-miR-203 in SiHa cells transduced with either the control vector (SiHa + ctrl) or hsa-miR-203 (SiHa + miR-203). In (B) cell viability is shown in SiHa + ctrl cells and SiHa + miR-203 cells. In (C) representative pictures of colony formation in soft agar of SiHa + ctrl cells and SiHa + miR-203 cells and in (D) quantification of the number of colonies in soft agar formed by SiHa + ctrl cells and SiHa + miR-203 cells.

Table 1. Primer and probe sequences used for (q)MSP analysis

Reprints and Corporate Permissions

Please note: Selecting permissions does not provide access to the full text of the article, please see our help page How do I view content?

To request a reprint or corporate permissions for this article, please click on the relevant link below:

Academic Permissions

Please note: Selecting permissions does not provide access to the full text of the article, please see our help page How do I view content?

Obtain permissions instantly via Rightslink by clicking on the button below:

If you are unable to obtain permissions via Rightslink, please complete and submit this Permissions form. For more information, please visit our Permissions help page.